
Articles
- Page Path
- HOME > Acute Crit Care > Volume 36(2); 2021 > Article
-
Original Article
Pulmonary Airway pressure release ventilation in mechanically ventilated patients with COVID-19: a multicenter observational study -
John S. Zorbas1, Kwok M. Ho2,3,4
 , Edward Litton3,5, Bradley Wibrow1,3, Edward Fysh6, Matthew H. Anstey1,3
 -
Acute and Critical Care 2021;36(2):143-150.
DOI: https://doi.org/10.4266/acc.2021.00017
Published online: May 4, 2021
1Intensive Care Department, Sir Charles Gairdner Hospital, Perth, Australia
2Intensive Care Department, Royal Perth Hospital, Perth, Australia
3University of Western Australia School of Medicine, Perth, Australia
4School of Veterinary & Life Sciences, Murdoch University, Perth, Australia
5Intensive Care Department, Fiona Stanley Hospital, Perth, Australia
6Intensive Care Department, St John of God Midland Hospital, Perth, Australia
- Corresponding author Matthew H. Anstey Intensive Care Department, Sir Charles Gairdner Hospital, Hospital Ave, Perth 6009, Australia Tel: +61-864571010 E-mail: Matthew.Anstey@health.wa.gov.au
Copyright © 2021 The Korean Society of Critical Care Medicine
This is an Open Access article distributed under the terms of the Creative Commons Attribution Non-Commercial License (http://creativecommons.org/licenses/by-nc/4.0/) which permits unrestricted non-commercial use, distribution, and reproduction in any medium, provided the original work is properly cited.
Abstract
-
Background
- Evidence prior to the coronavirus disease 2019 (COVID-19) pandemic suggested that, compared with conventional ventilation strategies, airway pressure release ventilation (APRV) can improve oxygenation and reduce mortality in patients with acute respiratory distress syndrome. We aimed to assess the association between APRV use and clinical outcomes among adult patients receiving mechanical ventilation for COVID-19 and hypothesized that APRV use would be associated with improved survival compared with conventional ventilation.
-
Methods
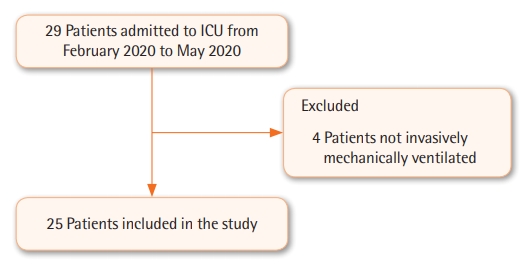
- A total of 25 patients with COVID-19 pneumonitis was admitted to intensive care units (ICUs) for invasive ventilation in Perth, Western Australia, between February and May 2020. Eleven of these patients received APRV. The primary outcome was survival to day 90. Secondary outcomes were ventilation-free survival days to day 90, mechanical complications from ventilation, and number of days ventilated.
-
Results
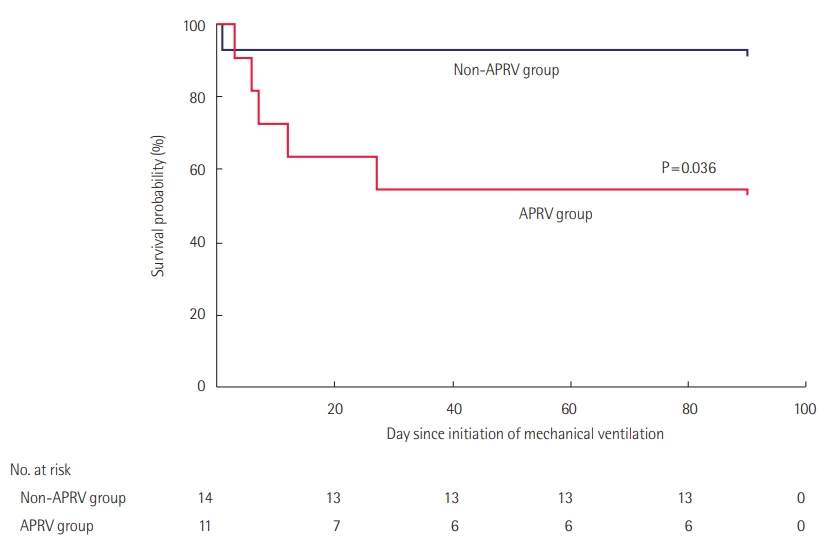
- Patients who received APRV had a lower probability of survival than did those on other forms of ventilation (hazard ratio, 0.17; 95% confidence interval, 0.03–0.89; P=0.036). This finding was independent of indices of severity of illness to predict the use of APRV. Patients who received APRV also had fewer ventilator-free survival days up to 90 days after initiation of ventilation compared to patients who did not receive APRV, and survivors who received APRV had fewer ventilator-free days than survivors who received other forms of ventilation. There were no differences in mechanical complications according to mode of ventilation.
-
Conclusions
- Based on the findings of this study, we urge caution with the use of APRV in COVID-19.
INTRODUCTION
MATERIALS AND METHODS
RESULTS
DISCUSSION
KEY MESSAGES
-
CONFLICT OF INTEREST
No potential conflict of interest relevant to this article was reported.
-
AUTHOR CONTRIBUTIONS
Conceptualization: JSZ, BW, EL, EF, MHA. Investigation: JSZ, KMH, EL, MHA. Data curation: JSZ. Formal analysis: KMH. Funding acquisition: MHA. Methodology: BW, MHA. Writing–original draft: JSZ, MHA. Writing–review & editing: BW, KMH, EL, EF.
NOTES
Acknowledgments
| Baseline characteristics | Treated with APRVa (n=11) | Untreated with APRV (n=14) | P-valueb |
|---|---|---|---|
| Age (yr) | 70 (69–77) | 72 (69–74) | 0.647 |
| Male sex | 8 (73) | 6 (43) | 0.227 |
| Weight (kg) | 84 (78–119) | 83 (68–95) | 0.373 |
| BMI (kg/m2) | 31 (28–46) | 27 (23–37) | 0.138 |
| Day of symptoms before admission | 6 (3–10) | 8 (3–14) | 0.709 |
| Hypertension | 10 (46) | 6 (86) | 0.093 |
| Diabetes mellitus | 3 (27) | 5 (36) | 0.999 |
| No. of quadrants with infiltrates on CXR | 3 (2–4) | 4 (3–4) | 0.467 |
| APACHE II score | 16 (12–26) | 17 (13–20) | 0.467 |
| First PaO2/FiO2 ratio (mm Hg) | 151 (72–178) | 157 (137–257) | 0.347 |
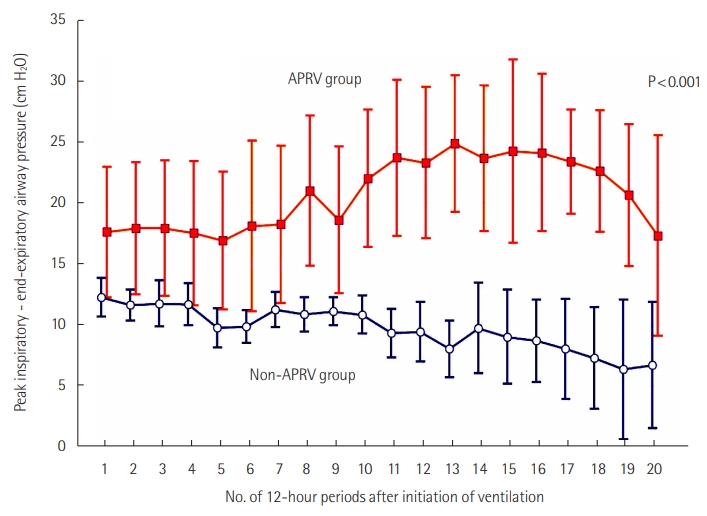
| First peak inspiratory pressure (cm H2O) | 24 (22–29) | 22 (20–26) | 0.267 |
| First PEEP (cm H2O) | 12 (1–12) | 10 (10–12) | 0.851 |
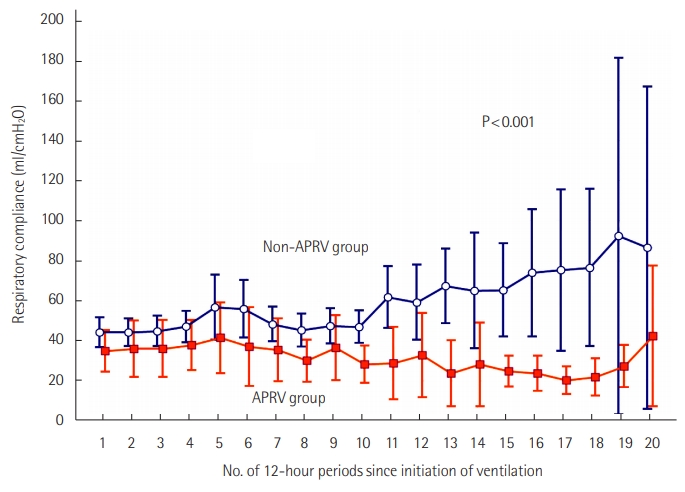
| First respiratory compliance (ml/cm H2O) | 32 (23–49) | 46 (35–50) | 0.222 |
Values are presented as median (IQR) or number (%).
APRV: airway pressure release ventilation; BMI: body mass index; CXR: chest X-ray; APACHE: Acute Physiology and Chronic Health Evaluation; PaO2: arterial oxygen partial pressure; FiO2: fractional inspired oxygen; PEEP: positive end-expiratory pressure; IQR: interquartile range.
a Median time to initiation of APRV from initiation of invasive mechanical ventilation was 1 day (IQR, 0–4; 4 patients on day 0, 3 patients on day 1, 1 patient each on days 3, 4, 5, and 6), and the median duration of APRV use was 7 days (IQR, 6–12);
b Categorical data (male sex, hypertension, diabetes mellitus) were analyzed by chi-square test and continuous data (all others) were analyzed by Mann-Whitney test.
| Outcome | Treated with APRVa (n=11) | Untreated with APRV (n=14) | P-valueb |
|---|---|---|---|
| Pneumothorax | 1 (9)c | 0 | 0.440 |
| Subcutaneous emphysema | 1 (9)c | 0 | 0.440 |
| Intercostal catheter | 1 (9)c | 0 | 0.440 |
| Tracheostomy | 2 (18) | 1 (7) | 0.565 |
| ICU mortality | 5 (46) | 1 (7) | 0.056 |
| Hospital mortality | 5 (46) | 1 (7) | 0.056 |
| Day 90 mortality | 5 (46) | 1 (7) | 0.056 |
| Ventilator-free survival day up to day 90 after initiation of ventilation | 57 (1–72) | 82 (73–85) | 0.001 |
| Ventilator-free day among survivors | 72 (65–78) | 82 (76–85) | 0.017 |
| Total mechanical ventilation day | 12 (7–23) | 8 (4–13) | 0.107 |
| ICU stay (day) | 20 (8–27) | 11 (7–15) | 0.120 |
| Hospital stay (day) | 33 (7–42) | 19 (14–32) | 0.609 |
| Hydroxychloroquine | 0 | 2 (14) | 0.191 |
Values are presented as number (%) or median (IQR).
APRV: airway pressure release ventilation; ICU: intensive care unit; IQR: interquartile range.
a Median time to initiation of APRV from initiation of invasive mechanical ventilation was 1 day (IQR, 0–4; 4 patients on day 0, 3 patients on day 1, 1 patient each on days 3, 4, 5, and 6), and median duration of APRV use was 7 days (IQR, 6–12);
b Categorical data (pneumothorax, subcutaneous emphysema, intercostal catheter, tracheostomy, mortality, hydroxychloroquine) were analyzed by chi-square test and continuous data (all others) were analyzed by Mann-Whitney test;
c Occurred 3 days after APRV was initiated in the same patient.
| Concurrent treatment | Treated with APRVa (n=11) | Untreated with APRV (n=14) | P-valueb |
|---|---|---|---|
| Azithromycin | 10 (91) | 11 (79) | 0.604 |
| Lopinavir/ritonavirc | 0 | 2 (14) | 0.174 |
| Corticosteroids | 3 (27) | 4 (29) | 0.943 |
| Vitamin C | 1 (9) | 0 | 0.250 |
| Prone ventilation | 5 (46) | 1 (7) | 0.056 |
| Day to initiation of prone ventilation from initiation of ventilation | 3 (3–5) | 2 (NA) | 0.333 |
| Nitric oxide | 5 (46) | 1 (7) | 0.050 |
| Day to initiation of nitric oxide | 3 (2–5) | 4 (NA) | 0.667 |
| Prostacyclin | 3 (27) | 0 | 0.072 |
| Day to initiation of prostacyclin | 3 (2-NA) | NA | NA |
Values are presented as number (%) or median (IQR). No patient was treated with renal replacement therapy, remdesivir, tocilizumab, anakinra, interferon 1b, or extracorporeal membrane oxygenation.
APRV: airway pressure release ventilation; NA, not applicable; IQR: interquartile range.
a Median time to initiation of APRV from initiation of invasive mechanical ventilation was 1 day (IQR, 0-4; 4 patients on day 0, 3 patients on day 1, 1 patient each on days 3, 4, 5, and 6), and median duration of APRV use was 7 days (IQR, 6–12);
b Categorical data (azithromycin, lopinavir/ritonavir, corticosteroids, vitamin C, prone ventilation, nitric oxide, prostacylin) were analyzed by chi-square test and continuous data (all others) were analyzed by Mann-Whitney test;
c Data from 24 patients were available.
The Hosmer-Lemeshow chi-square and Nagelkerke R2 of the model were 0.820 (P=0.999) and 0.840, respectively. Median and interquartile range of propensity scores for ICU survivors were 0.09 and 0.01–0.91, respectively, and those for ICU non-survivors were 0.95 and 0.16–0.99.
APRV: airway pressure release ventilation; CI: confidence interval; APACHE: Acute Physiology and Chronic Health Evaluation; PaO2: arterial oxygen partial pressure; FiO2: fractional inspired oxygen; CRP: C-reactive protein; CXR, chest X-ray.
| Covariate | HR associated with APRV in relation to survival to ICU discharge (95% CI) | P-value | HR associated with APRV in relation to survival to ICU discharge (95% CI) with adjustment for propensity score | P-value (including adjustment for propensity score) |
|---|---|---|---|---|
| APRV (yes vs. no) | 0.182 (0.06–0.584) | 0.004 | 0.03 (0.01–0.385) | 0.008 |
| APRV+APACHE II score | 0.176 (0.05–0.588) | 0.005 | 0.02 (0.01–0.316) | 0.005 |
| APRV+APACHE II score+PaO2/FiO2 ratio on initiation of mechanical ventilation | 0.08 (0.02–0.384) | 0.002 | 0.02 (0.01–0.328) | 0.007 |
| APRV+APACHE II score+PaO2/FiO2 ratio and respiratory compliance on initiation of mechanical ventilation | 0.07 (0.01–0.362) | 0.002 | 0.02 (0.01–0.334) | 0.007 |
| APRV+APACHE II score+PaO2/FiO2 ratio and respiratory compliance on initiation of mechanical ventilation+ corticosteroid therapy | 0.07 (0.01–0.356) | 0.002 | 0.02 (0.01–0.514) | 0.018 |
| APRV+ | 0.06 (0.01–0.359) | 0.002a | 0.02 (0.01–0.554) | 0.020 |
| APACHE II score+ | 0.88 (0.73–1.06) | 0.164 | 0.89 (0.73–1.08) | 0.238 |
| P/F ratio+ | 1.00 (0.99–1.01) | 0.575 | 1.00 (0.99–1.01) | 0.454 |
| Respiratory compliance on initiation MV+ | 0.99 (0.94–1.03) | 0.552 | 0.99 (0.95–1.04) | 0.645 |
| Corticosteroid therapy+ | 0.35 (0.04–3.47) | 0.371 | 0.60 (0.04–9.88) | 0.724 |
| No quadrants on CXR+ | 1.39 (0.47–4.16) | 0.554 | 1.30 (0.42–3.96) | 0.650 |
| Propensity score | Not included | - | 3.68 (0.11–119) | 0.463 |
APRV: airway pressure release ventilation; ICU: intensive care unit; HR: hazard ratio; CI: confidence interval; APACHE: Acute Physiology and Chronic Health Evaluation; PaO2: arterial oxygen partial pressure; FiO2: fractional inspired oxygen; CXR: chest X-ray.
a None of the other covariates other than APRV was associated with a P-value <0.05; the HR for ICU survival (0.06) and P-value (0.002) associated with APRV remained unchanged after 1,000 bootstrap resamplings to adjust for bias from overfitting or outliers.
- 1. Coronaviridae Study Group of the International Committee on Taxonomy of Viruses. The species severe acute respiratory syndrome-related coronavirus: classifying 2019-nCoV and naming it SARS-CoV-2. Nat Microbiol 2020;5:536-44.ArticlePubMedPMCPDF
- 2. World Health Organization. Timeline of WHO’s response to COVID-19 [Internet]. Geneva, World Health Organization. 2020;[cited 2020 Aug 29]. Available from: https://www.who.int/news-room/detail/29-06-2020-covidtimeline.
- 3. World Health Organization. Coronavirus disease (COVID-19) situation reports [Internet]. Geneva, World Health Organization. 2020;[cited 2020 Aug 29]. Available from: https://www.who.int/emergencies/diseases/novel-coronavirus-2019/situation-reports.
- 4. Bouadma L, Lescure FX, Lucet JC, Yazdanpanah Y, Timsit JF. Severe SARS-CoV-2 infections: practical considerations and management strategy for intensivists. Intensive Care Med 2020;46:579-82.ArticlePubMedPMC
- 5. Chen J, Qi T, Liu L, Ling Y, Qian Z, Li T, et al. Clinical progression of patients with COVID-19 in Shanghai, China. J Infect 2020;80:e1-e6.Article
- 6. Wu Z, McGoogan JM. Characteristics of and important lessons from the coronavirus disease 2019 (COVID-19) outbreak in china: summary of a report of 72 314 cases from the Chinese center for disease control and prevention. JAMA 2020;323:1239-42.ArticlePubMed
- 7. Docherty AB, Harrison EM, Green CA, Hardwick HE, Pius R, Norman L, et al. Features of 20133 UK patients in hospital with covid-19 using the ISARIC WHO clinical characterisation protocol: prospective observational cohort study. BMJ 2020;369:m1985. ArticlePubMedPMC
- 8. Potere N, Valeriani E, Candeloro M, Tana M, Porreca E, Abbate A, et al. Acute complications and mortality in hospitalized patients with coronavirus disease 2019: a systematic review and meta-analysis. Crit Care 2020;24:389. ArticlePubMedPMC
- 9. Lim J, Litton E. Airway pressure release ventilation in adult patients with acute hypoxemic respiratory failure: a systematic review and meta-analysis. Crit Care Med 2019;47:1794-9.ArticlePubMed
- 10. Modrykamien A, Chatburn RL, Ashton RW. Airway pressure release ventilation: an alternative mode of mechanical ventilation in acute respiratory distress syndrome. Cleve Clin J Med 2011;78:101-10.ArticlePubMed
- 11. Zhou Y, Jin X, Lv Y, Wang P, Yang Y, Liang G, et al. Early application of airway pressure release ventilation may reduce the duration of mechanical ventilation in acute respiratory distress syndrome. Intensive Care Med 2017;43:1648-59.ArticlePubMedPMC
- 12. Harris PA, Taylor R, Thielke R, Payne J, Gonzalez N, Conde JG. Research electronic data capture (REDCap): a metadata-driven methodology and workflow process for providing translational research informatics support. J Biomed Inform 2009;42:377-81.ArticlePubMed
- 13. Harris PA, Taylor R, Minor BL, Elliott V, Fernandez M, O’Neal L, et al. The REDCap consortium: Building an international community of software platform partners. J Biomed Inform 2019;95:103208. ArticlePubMedPMC
- 14. Gattinoni L, Chiumello D, Rossi S. COVID-19 pneumonia: ARDS or not? Crit Care 2020;24:154. ArticlePubMedPMC
- 15. Bos LD, Sinha P, Dickson RP. The perils of premature phenotyping in COVID-19: a call for caution. Eur Respir J 2020;56:2001768. ArticlePubMedPMC
- 16. Bos LD, Sinha P, Dickson RP. Response to COVID-19 phenotyping correspondence. Eur Respir J 2020;56:2002756. ArticlePubMedPMC
- 17. Rajendram R. Building the house of CARDS by phenotyping on the fly. Eur Respir J 2020;56:2002429. ArticlePubMedPMC
- 18. Ziehr DR, Alladina J, Petri CR, Maley JH, Moskowitz A, Medoff BD, et al. Respiratory pathophysiology of mechanically ventilated patients with COVID-19: a cohort study. Am J Respir Crit Care Med 2020;201:1560-4.ArticlePubMedPMC
- 19. Gattinoni L, Camporota L, Marini JJ. COVID-19 phenotypes: leading or misleading? Eur Respir J 2020;56:2002195. ArticlePubMedPMC
- 20. Botta M, Tsonas AM, Pillay J, Boers LS, Algera AG, Bos LD, et al. Ventilation management and clinical outcomes in invasively ventilated patients with COVID-19 (PRoVENT-COVID): a national, multicentre, observational cohort study. Lancet Respir Med 2021;9:139-48.PubMed
References
Figure & Data
References
Citations
- Airway Pressure Release Ventilation in COVID-19-Associated Acute Respiratory Distress Syndrome—A Multicenter Propensity Score–Matched Analysis
Jan-Hendrik Naendrup, Jonathan Steinke, Jorge Garcia Borrega, Sandra Emily Stoll, Per Ole Michelsen, Yannick Assion, Alexander Shimabukuro-Vornhagen, Dennis Alexander Eichenauer, Matthias Kochanek, Boris Böll
Journal of Intensive Care Medicine.2024; 39(1): 84. CrossRef - Acute Respiratory Failure From Early Pandemic COVID-19
Julia M. Fisher, Vignesh Subbian, Patrick Essay, Sarah Pungitore, Edward J. Bedrick, Jarrod M. Mosier
CHEST Critical Care.2024; 2(1): 100030. CrossRef - Airway Pressure Release Ventilation for Acute Respiratory Failure Due to Coronavirus Disease 2019: A Systematic Review and Meta-Analysis
Ashraf Roshdy, Ahmad Samy Elsayed, Ahmad Sabry Saleh
Journal of Intensive Care Medicine.2023; 38(2): 160. CrossRef - Techniques for Oxygenation and Ventilation in Coronavirus Disease 2019
Guy A. Richards, Oliver Smith
Seminars in Respiratory and Critical Care Medicine.2023; 44(01): 091. CrossRef - Does airway pressure release ventilation offer new hope for treating acute respiratory distress syndrome?
Jiangli Cheng, Aijia Ma, Meiling Dong, Yongfang Zhou, Bo Wang, Yang Xue, Peng Wang, Jing Yang, Yan Kang
Journal of Intensive Medicine.2022; 2(4): 241. CrossRef - Early spontaneous breathing for acute respiratory distress syndrome in individuals with COVID-19
Friedrich Hohmann, Lisa Wedekind, Felicitas Grundeis, Steffen Dickel, Johannes Frank, Martin Golinski, Mirko Griesel, Clemens Grimm, Cindy Herchenhahn, Andre Kramer, Maria-Inti Metzendorf, Onnen Moerer, Nancy Olbrich, Volker Thieme, Astrid Vieler, Falk Fi
Cochrane Database of Systematic Reviews.2022;[Epub] CrossRef - Respiratory system mechanics, gas exchange, and outcomes in mechanically ventilated patients with COVID-19-related acute respiratory distress syndrome: a systematic review and meta-analysis
Mallikarjuna Ponnapa Reddy, Ashwin Subramaniam, Clara Chua, Ryan Ruiyang Ling, Christopher Anstey, Kollengode Ramanathan, Arthur S Slutsky, Kiran Shekar
The Lancet Respiratory Medicine.2022; 10(12): 1178. CrossRef - Comparison of characteristics and ventilatory course between coronavirus disease 2019 and Middle East respiratory syndrome patients with acute respiratory distress syndrome
Imran Khalid, Romaysaa M Yamani, Maryam Imran, Muhammad Ali Akhtar, Manahil Imran, Rumaan Gul, Tabindeh Jabeen Khalid, Ghassan Y Wali
Acute and Critical Care.2021; 36(3): 223. CrossRef
 PubReader
 ePub Link
 Cite
Cite- Figure
-


- Related articles
-
- Percent fluid overload for prediction of fluid de-escalation in critically ill patients in Saudi Arabia: a prospective observational study
- Methylprednisolone pulse therapy for critically ill patients with COVID-19: a cohort study
- Measured versus estimated creatinine clearance in critically ill patients with acute kidney injury: an observational study
- Cinematic virtual reality for anxiety management in mechanically ventilated patients: a feasibility and pilot study

