Abstract
-
Background
- The Controlling Nutritional Status (CONUT) score and the prognostic nutritional index (PNI) have emerged as important nutritional indices because they provide an objective assessment based on data. We aimed to investigate how these nutritional indices relate to outcomes in patients with sepsis.
-
Methods
- Data were collected retrospectively at five hospitals for patients aged ≥18 years receiving treatment for sepsis between January 1, 2017, and December 31, 2021. Serum albumin and total cholesterol concentrations, and peripheral lymphocytes were used to calculate the CONUT score and PNI. To identify predictors correlated with 30-day mortality, analyses were conducted using univariate and multivariate Cox proportional hazards models.
-
Results
- The 30-day mortality rate among 9,763 patients was 15.8% (n=1,546). The median CONUT score was 5 (interquartile range [IQR], 3–7) and the median PNI score was 39.6 (IQR, 33.8–46.4). Higher 30-day mortality rates were associated with individuals with moderate (CONUT score: 5–8; PNI: 35–38) or severe (CONUT: 9–12; PNI: <35) malnutrition compared with those with no malnutrition (CONUT: 0–1; PNI: >38). With CONUT scores, the hazard ratio (HR) associated with moderate malnutrition was 1.52 (95% confidence interval [CI], 1.24–1.87; P<0.001); for severe, HR=2.42 (95% CI, 1.95–3.02; P<0.001). With PNI scores, the HR for moderate malnutrition was 1.29 (95% CI, 1.09–1.53; P=0.003); for severe, HR=1.88 (95% CI, 1.67–2.12; P<0.001).
-
Conclusions
- The nutritional indices CONUT score and PNI showed significant associations with mortality of sepsis patients within 30 days.
-
Keywords: malnutrition; mechanical ventilation; mortality; nutritional status; sepsis
INTRODUCTION
Sepsis, in which the uncontrolled host reaction to infection results life-threatening organ dysfunction, is a major cause of morbidity and mortality worldwide [1]. Malnutrition is a factor that further exacerbates the severity and outcome of this disease, contributing to inadequate nutrient intake and being associated with immune dysfunction [2], inflammation [3], and increased mortality [4]. Recognizing the potential interplay between these two conditions, we sought to understand their combined impact on patient health by investigating the relationship between malnutrition markers and patient outcomes with the aim of improving care for this vulnerable patient population.
The intricate relationship between malnutrition, metabolic responses, and sepsis is not fully understood. In the clinical setting, basic methods such as dietary records and weight measurement can be limited in assessing a patient's nutritional status. The Controlling Nutritional Status (CONUT) score and the prognostic nutritional index (PNI) have emerged as important nutritional indices because they provide an objective assessment based on data [5,6]. They incorporate parameters such as serum albumin and total cholesterol concentrations, and peripheral lymphocytes to provide a more comprehensive assessment of an individual's nutritional health. These indices are widely used to assess nutrition in patients with malignancies [7,8], stroke [9,10], and sepsis [11]. Moreover, early nutrition status is associated with the duration of mechanical ventilation [12].
Data are limited for patients with sepsis and for sepsis patients receiving mechanical ventilation. Therefore, we utilized CONUT score and PNI to determine how nutritional status affects outcomes in patient with sepsis and for sepsis patients receiving mechanical ventilation.
MATERIALS AND METHODS
Study Design and Patients
This study was conducted at five medical university-affiliated hospitals in the Republic of Korea. Our Medical Center comprises hospitals in different provinces and adopted a Clinical Data Warehouse system to extract electronic medical records. Data were retrospectively collected from patients aged ≥18 years who were hospitalized to the intensive care unit (ICU) between January 1, 2017, and December 31, 2021. To set the index time as the first record in the emergency room (ER), we enrolled patients who were hospitalized to the ICU via the ER. Therefore, patients admitted through departments other than the ER, patients admitted more than 24 hours after their ER visit, patients who did not meet the criteria for a sepsis diagnosis (did not have a blood culture, did not receive antibiotic treatment within 24 hours of the ER visit, did not meet antibiotic criteria for infection, or had a Sequential Organ Failure Assessment [SOFA] score ≤1), underwent surgery during hospitalization, and patients with missing SOFA or nutritional score data or outliers in WBC and lactate were excluded from the study.
This retrospective study protocol was authorized by the Institutional Review Board of Chuncheon Sacred Heart Hospital, Hallym University (No. 2023-10-002). Informed consent was waived due to the retrospective nature of the study. All procedures in this study were performed in accordance with the relevant guidelines and regulations.
Data Collection
Within 24 hours of the ER visit, the following information was obtained: age, sex, body mass index, systemic inflammatory response syndrome (SIRS) status, SOFA score, quick SOFA (qSOFA) score, Acute Physiology and Chronic Health Evaluation (APACHE) II score, principal diagnosis, comorbidities, Charlson Comorbidity Index, vital signs, laboratory results including arterial blood gases (the earliest blood test result within 24 hours of the ER visit), and use of mechanical ventilation, renal replacement therapy, vasopressors or corticosteroids, or blood transfusion. Outcome variables included 30-day mortality, duration of hospital stay, duration of ICU stay, and duration of ventilator use.
Diagnosis and Definitions
We examined all patients admitted to the intensive care unit via the emergency department. All diagnoses were based on vital signs taken immediately after arrival at the emergency department. Infected patients were defined when they met the following criteria: Blood culture and intravenous antibiotics application within 24 hours of presentation, and antibiotics application for at least 4 sequential days (hospital stay ≥4 days), or antibiotics continuation until 1 day prior to death or discharge (hospital stay ≤3 days) [13]. Sepsis and septic shock were defined based on the Sepsis-3 criteria [1]. Sepsis was defined by a SOFA score ≥2 in patients who fulfilled the criteria for infection. Septic shock was determined by use of vasopressors and lactate levels >2 mmol/L on the day of presentation.
The qSOFA score was defined as the sum of three components: respiratory rate ≥22/min, systolic blood pressure ≤100 mm Hg, and Glasgow Coma Scale <15. The SIRS criterion was defined as the sum of four factors: heart rate >90 bpm, respiratory rate >20/min or PCO2 <32 mm Hg, body temperature >38 °C or <36 °C, white blood cell count >12,000/μl or <4,000/μl, or band >10% [14].
Nutritional Status Assessments
The nutritional status of sepsis patients was evaluated using the CONUT score and the PNI. The CONUT score was calculated based on serum albumin concentration, serum total cholesterol concentration, and total peripheral lymphocyte count. These parameters were measured against their respective normal ranges and then combined to create a score. Patients were grouped into risk categories of absent (score 0–1), mild (2–4), moderate (5–8), and severe (9–12) malnutrition based on the comprehensive score [9]. PNI scores were calculated as 5×lymphocyte count (×109/L)+10×serum albumin concentration (g/dl), with absent, moderate, and severe malnutrition risk is defined as >38, 35–38, and <35, respectively [11]. Details of the nutritional assessment methods are described in more detail in Supplementary Table 1.
Statistical Analysis
Categorical variables are presented as numbers (percentages). Continuous variables are presented as medians and interquartile ranges (IQRs). Pearson's chi-square test was used for comparisons of categorical variables and Mann-Whitney test was used for comparisons of continuous variables. Kaplan-Meier analysis was used to assess cumulative mortality over a 30-day period, and the log-rank test was employed for comparing the Kaplan-Meier curves. Both the CONUT score and PNI were evaluated in two ways: as continuous variables or grouped into four (absent, mild, moderate, or severe) or three (absent, moderate, or severe) categories.
To identify predictors associated with 30-day mortality, analyses were conducted using univariate and multivariate Cox proportional hazards models. Multiple testing issues were handled by Bonferroni correction, and the criterion to be considered statistically significant was set at P<0.025, which is the result of the usual P-value threshold (0.05) divided by the scores (CONUT score and PNI). Statistical analyses were conducted using IBM SPSS ver. 26.0 (IBM Corp.).
RESULTS
Patient Characteristics
A total of 55,273 patients aged ≥18 years were hospitalized to the ICU during the time period (Figure 1). Forty-four thousand eight hundred fifty-four patients who did not fulfill the study criteria were excluded. The reasons were as follows: admitted through alternative channels besides the ER department (n=17,395), blood cultures were not obtained (n=17,911), did not receive antibiotic treatment within 24 hours of visit to the ER (n=3,289), admitted to the ICU 24 hours after the ER visit (n=193), did not meet antibiotic criteria for infection (n=3,503), underwent surgery during hospitalization (n=1,679), and had missing SOFA or nutrition score data (n=884). This resulted in 10,419 patients with infection being enrolled, of which 618 patients with a SOFA score ≤1 and an additional 38 patients with outlier WBC and lactate levels were excluded, resulting in 9,763 patients with sepsis finally being enrolled in the study.
Median SOFA score for all sepsis patients was 5 (IQR, 3–7), and median APACHE II score was 17 (IQR, 13–22). Septic shock occurred in 20.4% of the patients and 23.0% of patients were mechanically ventilated. Overall, 30-day mortality was 15.8% (n=1,546). Baseline characteristics of sepsis patients categorized by 30-day mortality status are presented in (Table 1). Compared to 30-day survivors, 30-day non-survivors had significantly higher SOFA scores (7 [IQR, 4–9] vs. 5 [IQR, 3–7], P<0.001] and APHACHE II scores (21 [IQR, 16–27] vs. 16 [IQR, 12–21], P<0.001]. Rates of septic shock (27.4% vs. 19.0%, P<0.001), use of mechanical ventilation (38.9% vs. 20.0%, P<0.001), and use of vasopressors (62.5% vs. 42.1%, P<0.001) were also significantly higher in non-survivors relative to survivors. Additionally, the presence of COVID-19 was significantly higher among non-survivors compared to survivors (2.8% vs. 1.8%, P=0.012).
Assessment of Nutritional Status among Patient Groups
Of the 9,763 patients evaluated in the study, the median CONUT score was 5 (IQR, 3–7); 1,235 (12.6%) had a CONUT score of 0 to 1 (signifying normal nutritional status), 3,112 (31.9%) had a score of 2 to 4 (mild), 3,788 (38.8%) had a score of 5 to 8 (moderate) and 1,628 (16.7%) had a score of 9 to 12 (severe). The median PNI was 39.6 (IQR, 33.8–46.4); 5,580 (57.2%) had a score ≥38 (reflecting normal nutritional status), 1,253 (12.8%) had a score between 35 and 38 (moderate), and 2,930 (30.0%) had a score <35 (severe).
CONUT score and PNI in 30-day survivors and 30-day non-survivors exhibited significant differences (CONUT: 5 [IQR, 3–7] vs. 7 [IQR, 4–9], P<0.001; PNI: 40.2 [IQR, 34.5–46.8] vs. 35.9 [IQR, 30.1–43.5], P<0.001). The 30-day non-survivor cohort also had higher prevalence of moderate and severe malnutrition categories for CONUT (70.0% vs. 52.7%, P<0.001) and PNI (58.7% vs. 39.9%, P<0.001) scores (Table 2).
Kaplan-Meier Curve Analysis for 30‑Day Mortality
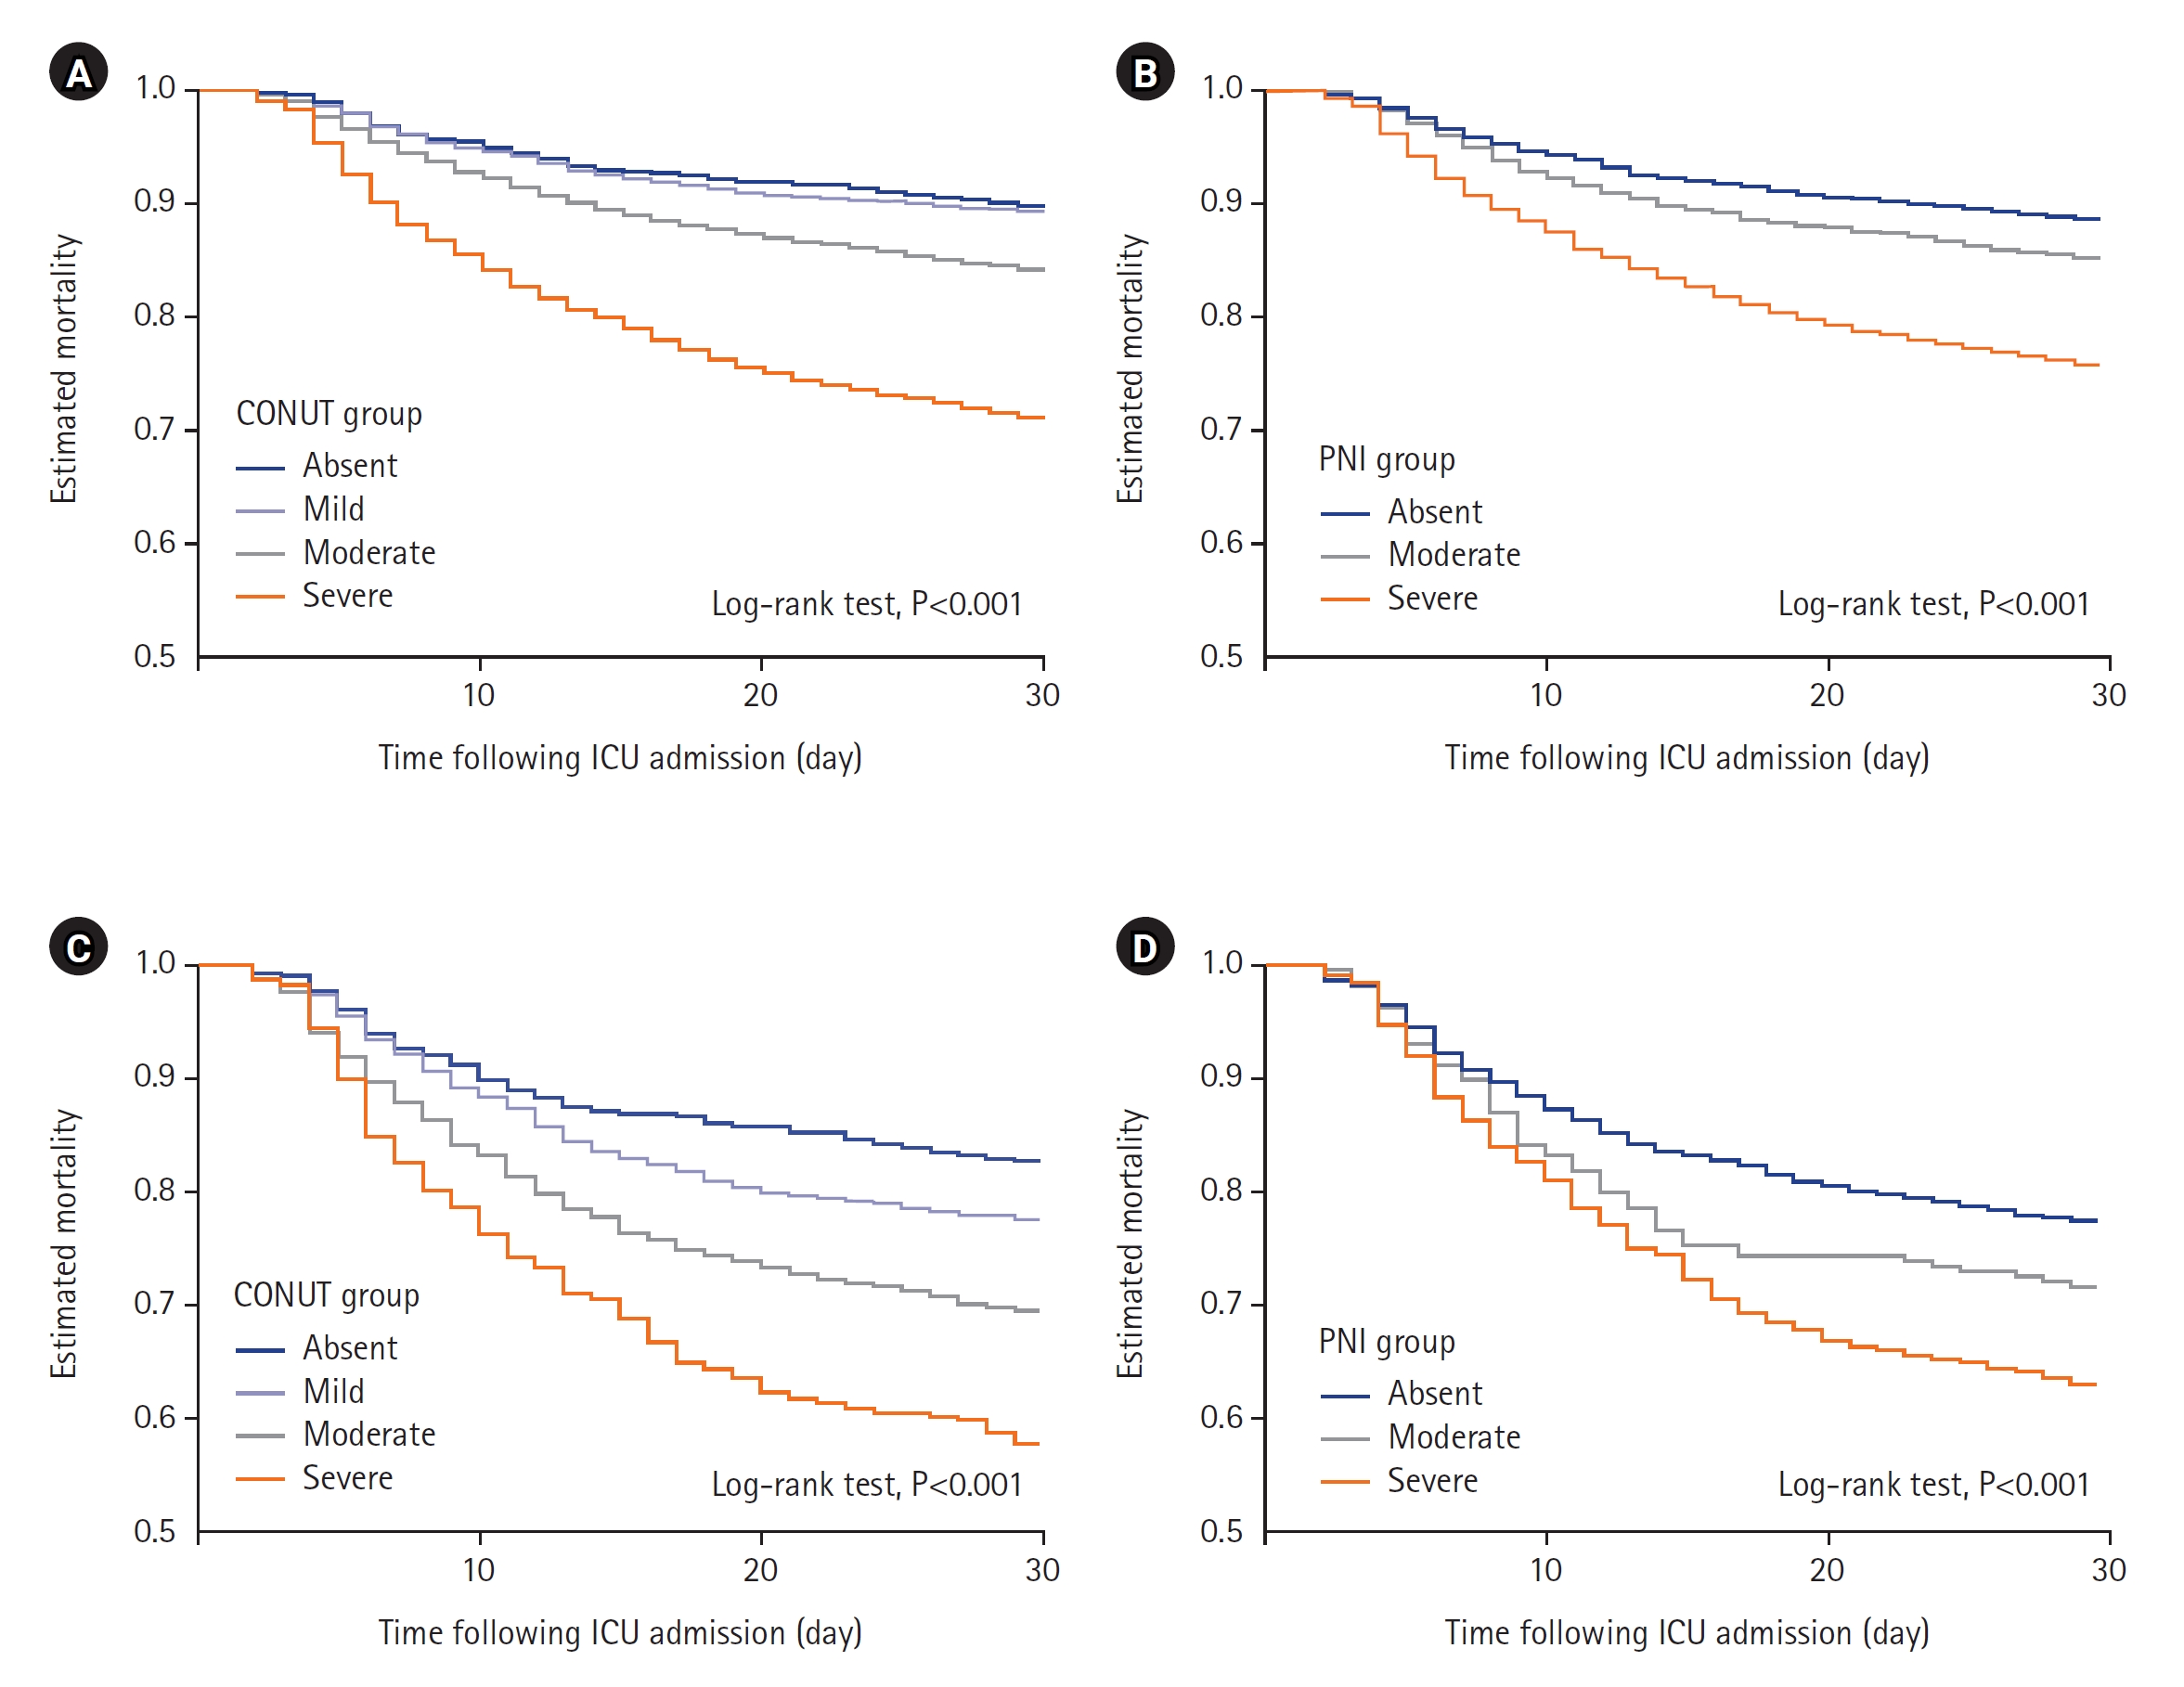
Figure 2 provides a graphical representation of the Kaplan-Meier survival analysis of 30-day mortality. For CONUT scores, 30-day survival rates associated with absent, mild, moderate, and severe malnutrition risk categories were 89.7%, 89.2%, 84.0%, and 70.8%, sequentially (log-rank P<0.001). For PNI scores, 30-day survival rates with absent, moderate, and severe malnutrition risk categories were 88.6%, 84.9%, and 75.5%, sequentially (log-rank P<0.001).
Impact of Nutritional Status of Sepsis Patients and 30-Day Mortality
Multivariable analysis showed that patients with moderate or severe malnutritional status, as assessed by CONUT scores, had a markedly increased risk of mortality within 30 days (HR for moderate: 1.52; 95% confidence interval [CI], 1.24–1.87; P<0.001 and for severe: 2.42; 95% CI, 1.95–3.02; P<0.001) relative to patients with CONUT scores indicating no malnutrition risk. Using PNI scores, individuals with moderate or severe malnutritional status also had a markedly increased risk of mortality within 30 days (HR for moderate: 1.29; 95% CI, 1.09–1.53; P=0.003 and for severe: 1.88; 95% CI, 1.67–2.12; P<0.001) relative to patients with PNI scores indicating no malnutrition after accounting for potential confounders. When considering a 1-point increase in PNI score, multivariable analysis showed a decreased risk (HR, 0.98; 95% CI, 0.98–0.99; P<0.001) (Table 3).
Fully adjusted hazard ratios from multivariate analysis, including CONUT score (A) and PNI score (B), are shown in Figure 3, which considers various clinical factors such as age, sex, body mass index, SOFA score, APACHE II score, Charlson comorbidity index, C-reactive protein, use of mechanical ventilation, renal replacement therapy, use of vasopressors, use of corticosteroids, and blood transfusions.
Mechanically Ventilated Sepsis Patients
Comparisons between survivors and non-survivors in mechanically ventilated patients are described in Supplementary Table 2. CONUT scores were higher and PNI scores were lower in non-survivors relative to survivors (5 [IQR, 2–8] vs. 3 [IQR, 1–6], P<0.001 and 40.8 [IQR, 31.9–52.7] vs. 44.2 [IQR, 36.6–55.2], P<0.001, respectively) (Table 2).
Kaplan‒Meier survival analyses shows that CONUT score and PNI are significantly associated with 30-day mortality in patients with sepsis who received mechanical ventilation (Figure 2). For CONUT scores, the HR of severe malnutrition risk was 2.04 (95% CI, 1.50–2.76; P<0.001). For PNI scores, the HR of severe malnutrition risk was 1.47 (95% CI, 1.19–1.81; P<0.001). Fully adjusted hazard ratios from multivariate analysis, including CONUT score (A) and PNI score (B), are shown in Supplementary Figure 1.
DISCUSSION
The correlation between nutritional scores and mortality in both sepsis patients and sepsis patients receiving mechanical ventilation was investigated in this multicenter study. The nutrition scores CONUT score and PNI were each significantly correlated mortality within 90 days in both groups. Multivariable Cox proportional hazard regression analyses revealed that CONUT score and PNI are independently influenced mortality rates in sepsis patients. Furthermore, we found that mortality has a linear correlation with PNI categories (absent, moderate, and severe) in sepsis patients with sepsis patients who received mechanical ventilation. Malnutrition exhibits a significant association to poor outcomes in patients with sepsis, and these indices can be helpful for predicting mortality.
The Surviving Sepsis Campaign emphasizes that poor nutritional status can affect outcomes and recommends early enteral feeding and nutrition support assessment [15]. Nutrition practice guidelines have recommended using a validated scoring system such as the Nutritional Risk Score 2002 (NRS-2002) or the Nutrition Risk in Critically Ill score (NUTRIC) Score for the determination of nutritional risk in hospitalized patients [16,17]. NRS-2002 incorporated with body mass index, weight loss within 3 months, reduced dietary intake in the last week, and disease severity [18], can effectively discriminate the outcome in patients with sepsis [19]. NUTRIC score included variables with age, number of comorbidities, days from hospital admission to ICU admission, APACHE II score, SOFA score, and serum IL-6 level [20]. Modified NUTRIC score, which is NUTRIC score without IL-6 level, at ICU admission can predicted 28-day mortality (area under the curve, 0.833; P<0.001) in patients with sepsis [21]. However, PNI and CONUT scores are simpler and more objective than those scores. PNI is a commonly used nutritional index that is associated with systemic inflammation. Ardehali et al. [11] reported that critically ill patients with low PNI scores had higher serum levels of interleukin-6 and high-sensitivity C-reactive protein. Therefore, PNI scores are considered a prognostic factor for patients with sepsis. Wu et al. [22] revealed that a PNI score ≥29.3 was identified as an independent predictor of mortality of sepsis patients within 30 days (HR, 0.65; 95% CI, 0.56–0.76). Moreover, our results showed that the malnutrition category based on PNI score (absent, moderate, and severe) exhibited a linear correlation with mortality.
CONUT scores are categorized into malnutrition categories of absent, mild, moderate, and severe. Our results showed a significant association between malnutrition category and mortality; however, the difference in mortality risk between the absent and mild CONUT categories is minimal (Figure 2A). Notably, Kyo et al. [23] reported that CONUT scores exhibited a linear association with mortality. They analyzed approximately 32,000 sepsis patients from 42 hospitals in Japan; however, differences from our study includes median age >79 years, a low mortality rate (11%), and large differences in CONUT scores between survivors and non-survivors. Therefore, these demographic differences must be considered when predicting the mortality of sepsis patients using nutritional indices.
One notable finding of this study is that the CONUT score and PNI nutritional indices independently influenced mortality rates in sepsis patients on mechanical ventilation. Malnutrition is directly related to an increase in the incidence of complications and mortality in patients receiving mechanical ventilation with shock [24,25]. Furthermore, identifying the risk of malnutrition in mechanically ventilated patients is challenging [26]. In this regard, nutritional indices can be useful prognostic indicators in mechanically ventilated sepsis patients. Compared to the overall sepsis patient cohort, mechanically ventilated sepsis patients were younger (median 70 years old) and had a better nutritional status. Kyo et al. [23] reported that mortality risk increases sharply when the PNI score is <40, however, the mortality rate plateaus when the PNI score is >40. However, in our study population where the median PNI score for all mechanically ventilated sepsis patients was 43.8 (Table 2), the moderate and severe groups were associated with significantly higher mortality hazard ratios relative to the absent group (Table 3).
Our study has several limitations. First, due to the nature of retrospective study, some data are missing, such as the grade of sarcopenia or clinical frailty scale. Second, the existence of unconsidered confounding factors that contribute to mortality in patients with sepsis cannot be ruled out. Mortality can be influenced by supply of protein or energy in the early phase of sepsis [27]. We did not analyze data such as energy supply or route of nutrition delivery in the early phase of sepsis. Third, we did not adjust for several factors that affect albumin, cholesterol, or lymphocyte levels. For example, liver cirrhosis leads to water retention that dilutes the content of albumin, resulting in hypoalbuminemia [28]. Moreover, some patients may be taking cholesterol-lowering medications. Fourth, although we collected data based on the definition of Sepsis-3 criteria [1], it cannot be completely ruled out that patients who are not septic may be included within the septic cohort. More prospective studies are essential to evaluate the efficacy of improving nutritional indices in patients with sepsis.
In conclusion, the scores of nutrition indices CONUT score and PNI were strongly correlated with mortality within 90 days in sepsis patients and mechanically ventilated sepsis patients. Malnutrition status correlates unfavorable consequences in patients with sepsis and measuring these indices at the presentation of sepsis can be helpful in predicting mortality.
HIGHLIGHTS
▪ In patients with sepsis, the nutritional indices Controlling Nutritional Status score and the prognostic nutritional index were correlated with mortality within 30 days.
▪ In sepsis patients and mechanically ventilated sepsis patients, nutritional status was correlated with mortality within 30 days.
NOTES
-
CONFLICT OF INTEREST
No potential conflict of interest relevant to this article was reported.
-
FUNDING
None.
-
AUTHOR CONTRIBUTIONS
Conceptualization: MSB, JHK. Data curation: DS, SSK, YY, JHK. Formal analysis: DS, SSK, YY, JHK. Methodology: MSB, JHK, YSK. Project administration: JHK. Visualization: JHK, YSK. Writing–original draft: JHK, MSB. Writing–review & editing: MSB, JHK, YSK.
-
ACKNOWLEDGMENTS
None.
SUPPLEMENTARY MATERIALS
Supplementary materials can be found via https://doi.org/10.4266/acc.2023.01613.
Supplementary Figure 1.
Forest plot of hazard ratio for 30-day mortality based on multivariate analysis with clinical variables and (A) Controlling Nutrition Status (CONUT) scores. (B) prognostic nutritional index (PNI) scores in mechanically ventilated patients. HR: hazard ratio; CI: confidence interval; SOFA: Sequential Organ Failure Assessment; APACHE: Acute Physiology And Chronic Health Evaluation.
acc-2023-01613-Supplementary-Figure-1.pdf
Figure 1.Flowchart of the enrollment process. ICU: intensive care unit; ER: emergency room; SOFA: Sequential Organ Failure Assessment; WBC: white blood cell.
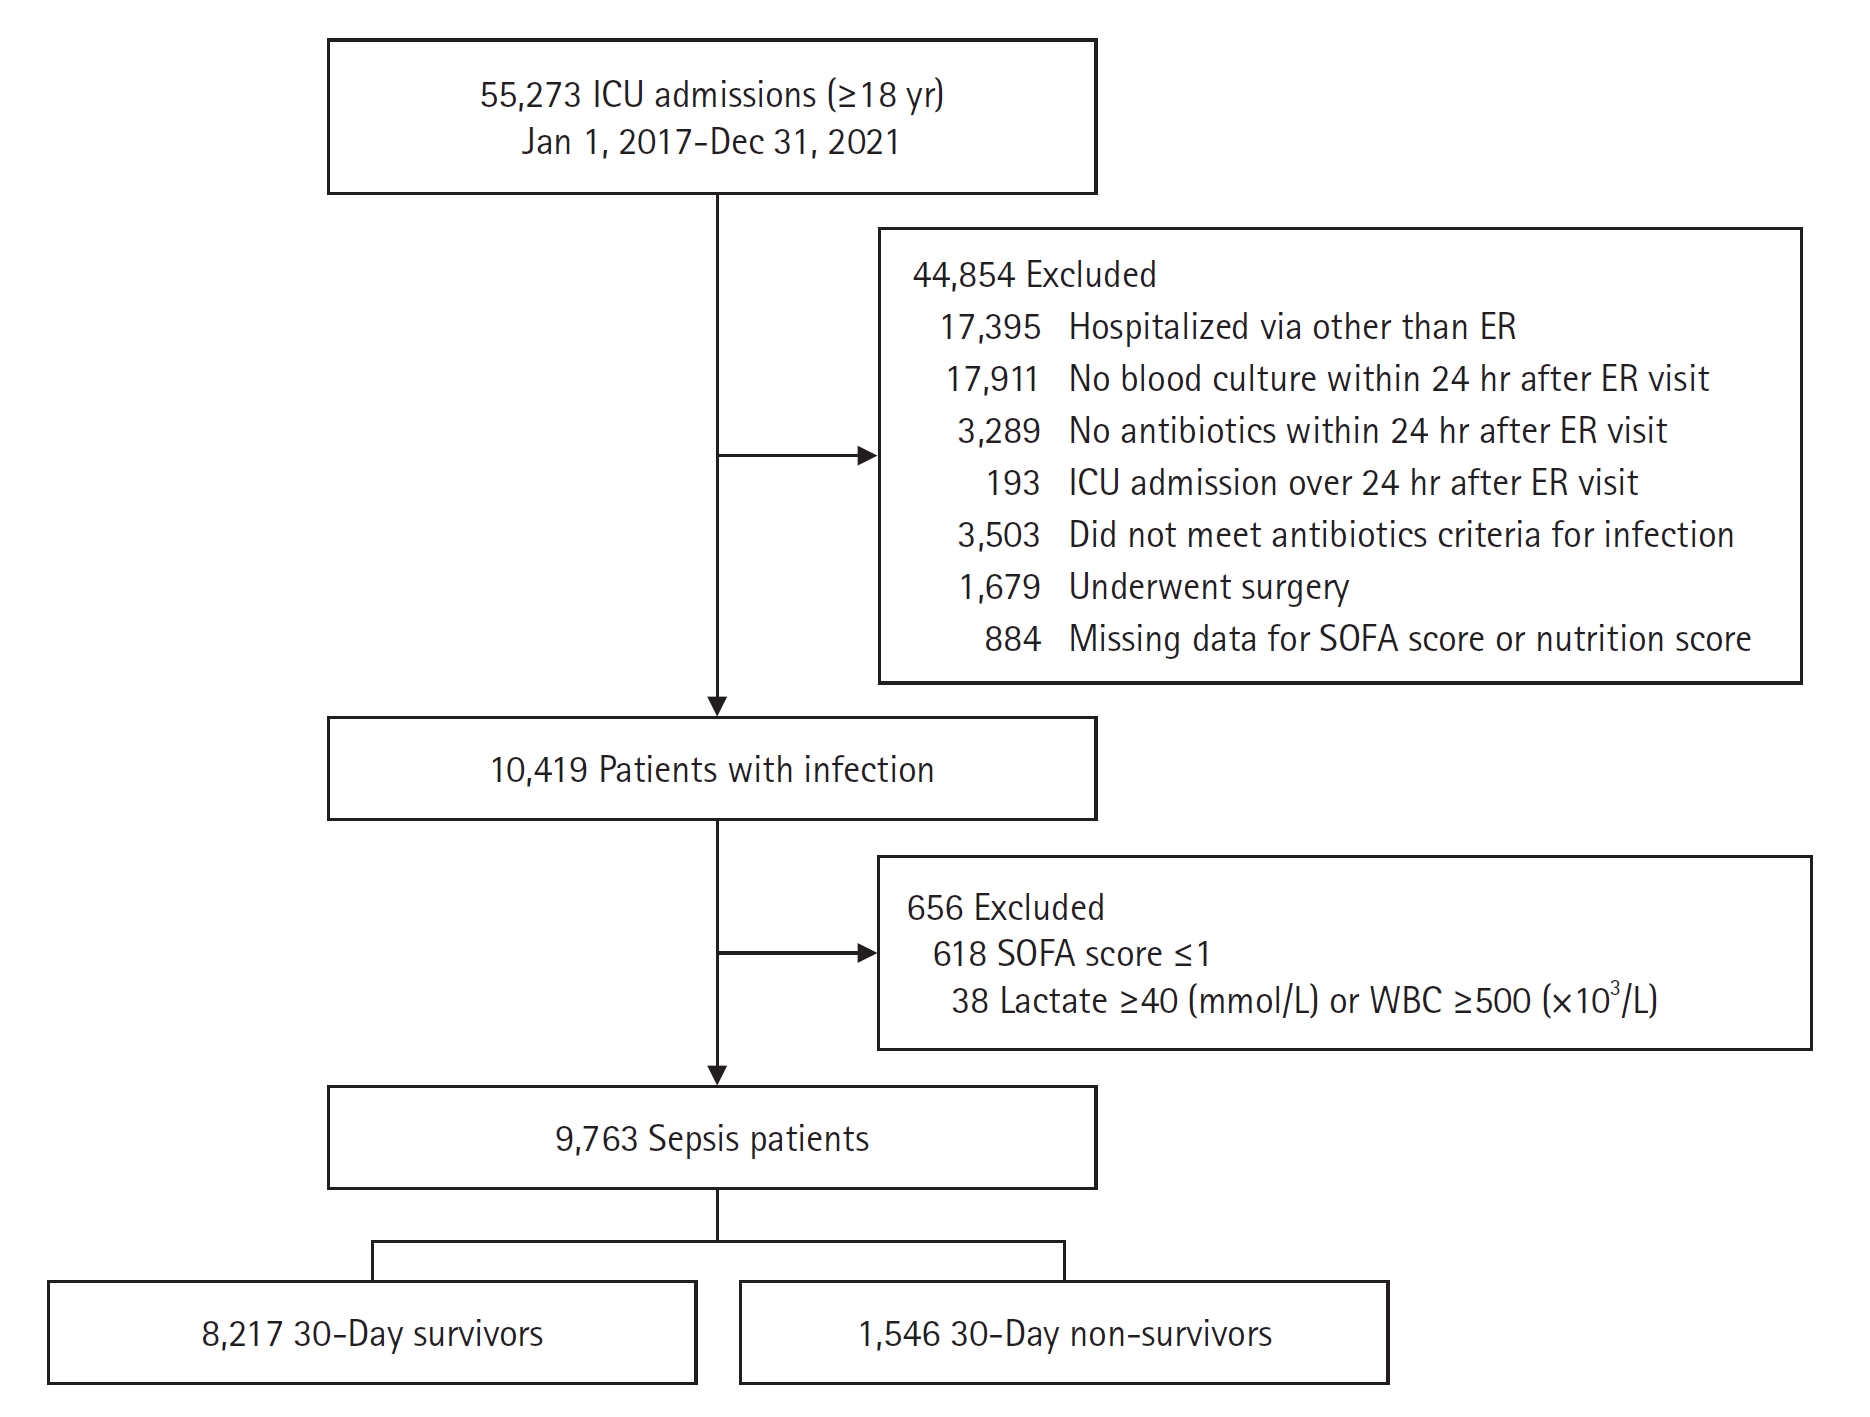
Figure 2.Survival curve of nutrition indices for sepsis mortality. (A) Controlling Nutrition Status (CONUT) scores in all sepsis patients. (B) Prognostic nutritional index (PNI) scores in all sepsis patients. (C) CONUT scores in mechanically ventilated (MV) sepsis patients. (D) PNI scores in MV sepsis patients. ICU: intensive care unit.

Figure 3.Forest plot of hazard ratios for 30-day mortality based on multivariate analysis with clinical variables. (A) Controlling Nutrition Status (CONUT) scores. (B) Prognostic nutritional index (PNI) scores. HR: hazard ratio; CI: confidence interval; SOFA: Sequential Organ Failure Assessment; APACHE: Acute Physiology And Chronic Health Evaluation.
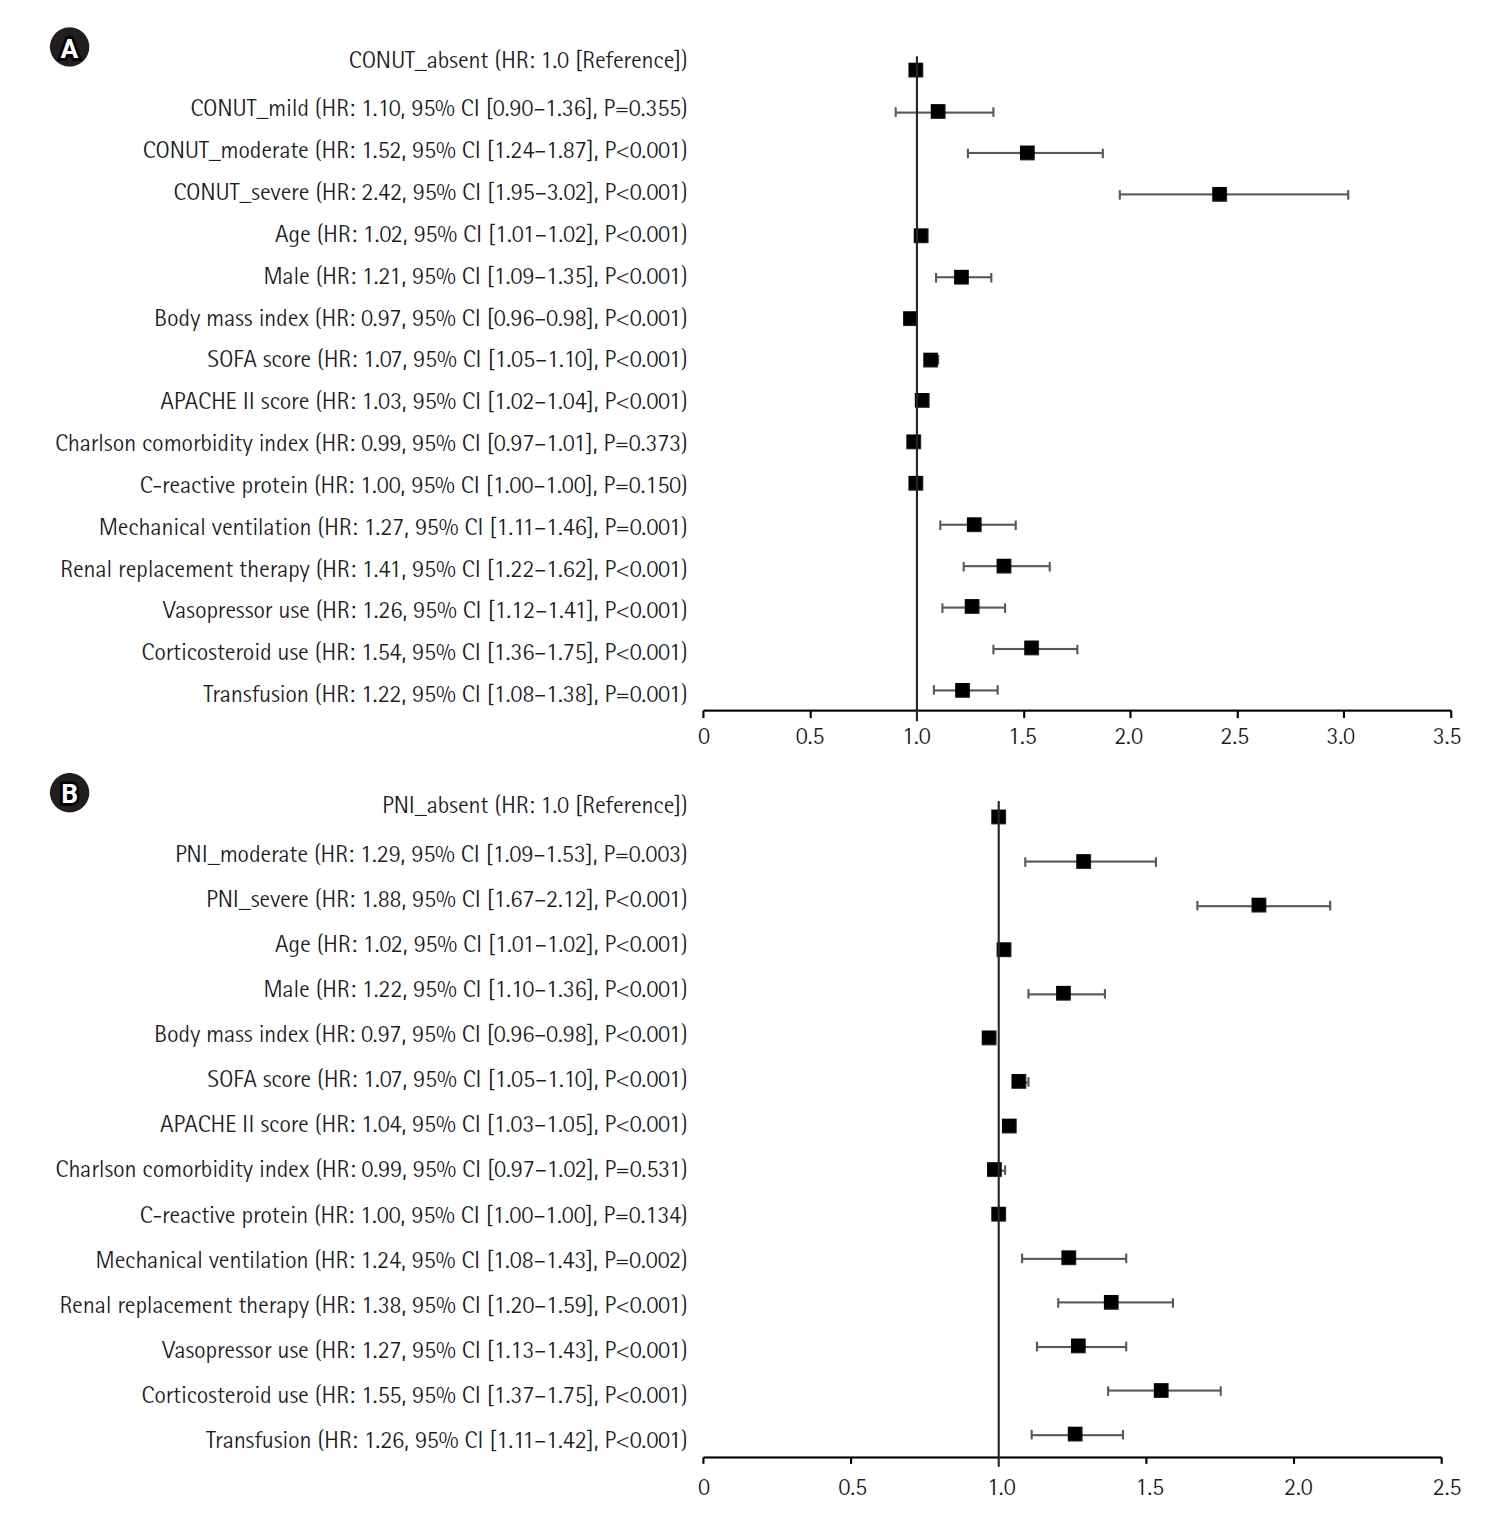
Table 1.Comparison of baseline characteristics
|
Variable |
30-Day survivor (n=8,217) |
30-Day non-survivor (n=1,546) |
P-value |
|
Age (yr) |
74 (62–82) |
78 (67–84) |
<0.001 |
|
Male |
4,711 (57.3) |
972 (62.9) |
<0.001 |
|
Body mass index (kg/m2) |
22.0 (19.5–24.6) |
20.8 (18.5–23.9) |
<0.001 |
|
SIRS |
2 (1–3) |
2 (2–3) |
<0.001 |
|
Quick SOFA score |
1 (1–2) |
2 (1–2) |
<0.001 |
|
SOFA score |
5 (3–7) |
7 (4–9) |
<0.001 |
|
APACHE II score |
16 (12–21) |
21 (16–27) |
<0.001 |
|
Septic shock |
1,564 (19.0) |
423 (27.4) |
<0.001 |
|
Charlson comorbidity index |
5 (4–7) |
6 (4–7) |
<0.001 |
|
Comorbidity |
|
|
|
|
Hypertension |
4,983 (60.6) |
917 (59.3) |
0.341 |
|
Diabetes |
3,426 (41.7) |
585 (37.8) |
0.005 |
|
Cardiac disease |
2,774 (33.8) |
536 (34.7) |
0.506 |
|
Chronic lung disease |
1,769 (21.5) |
320 (20.7) |
0.486 |
|
Chronic renal disease |
1,554 (18.9) |
289 (18.7) |
0.868 |
|
Chronic liver disease |
1,226 (14.9) |
213 (13.8) |
0.261 |
|
Cerebrovascular disease |
2,741 (33.4) |
476 (30.8) |
0.052 |
|
Solid cancer |
1,653 (20.1) |
417 (27.0) |
<0.001 |
|
Hematologic malignancy |
99 (1.2) |
29 (1.9) |
0.045 |
|
COVID-19 |
151 (1.8) |
44 (2.8) |
0.012 |
|
Vital sign |
|
|
|
|
Systolic blood pressure (mm Hg) |
122 (105–142) |
115 (98–136) |
<0.001 |
|
Diastolic blood pressure (mm Hg) |
72 (61–85) |
69 (58–81) |
<0.001 |
|
Respiratory rate (/min) |
20 (17–24) |
21 (17–25) |
<0.001 |
|
Heart rate (/min) |
94 (80–109) |
100 (85–115) |
<0.001 |
|
Body temperature (ºC) |
36.6 (36.2–37.2) |
36.4 (36.0–36.9) |
<0.001 |
|
Glasgow coma scale |
14 (9–15) |
10 (5–14) |
<0.001 |
|
Laboratory data |
|
|
|
|
White blood cell count (´103/L) |
11.5 (8.0–16.1) |
12.0 (8.0–16.9) |
0.005 |
|
Lymphocyte cell count (´103/L) |
1.0 (0.6–1.7)) |
0.9 (0.5–1.7 |
0.088 |
|
Hemoglobin |
11.7 (9.9–13.5) |
11.0 (9.1–13.0) |
<0.001 |
|
Platelet count (´103/L) |
204 (140–278) |
193 (118–265) |
<0.001 |
|
Albumin (g/dl) |
3.5 (3.0–3.9) |
3.1 (2.6–3.6) |
<0.001 |
|
Cholesterol (g/dl) |
129 (100–162) |
114 (87–147) |
<0.001 |
|
Creatinine (mg/dl) |
1.2 (0.8–2.0) |
1.4 (0.9–2.3) |
0.055 |
|
C-reactive protein (mg/dl) |
59.5 (10.9–153.2) |
86.3 (24.2–178.7) |
<0.001 |
|
Procalcitonin (mmol/L) |
0.6 (0.1–4.9) |
0.9 (0.2–5.3) |
0.835 |
|
Lactic acid (mmol/L) |
2.0 (1.2–3.8) |
2.9 (1.6–6.2) |
<0.001 |
|
Mechanical ventilation |
1,643 (20.0) |
602 (38.9) |
<0.001 |
|
Renal replacement therapy |
724 (8.8) |
298 (19.3) |
<0.001 |
|
Vasopressor use |
3,458 (42.1) |
967 (62.5) |
<0.001 |
|
Corticosteroid use |
1,083 (13.2) |
344 (22.3) |
<0.001 |
|
Transfusion |
1,341 (16.3) |
388 (25.1) |
<0.001 |
|
Length of stay (day) |
15 (10–25) |
11 (7–17) |
<0.001 |
|
ICU stay (day) |
5 (3–10) |
8 (5–14) |
0.002 |
|
Duration of MV (day) |
0 (0–2) |
5 (0–10) |
<0.001 |
Table 2.Malnutrition evaluation based on CONUT and PNI scores
|
Variable |
Total |
30-Day survivor |
30-Day non-survivor |
P-value |
|
Overall patients |
(n=9,763) |
(n=8,217) |
(n=1,546) |
|
|
CONUT score |
5 (3–7) |
5 (3–7) |
7 (4–9) |
<0.001 |
|
CONUT category |
|
|
|
<0.001 |
|
Absent (0–1) |
1,235 (12.6) |
1,108 (13.5) |
127 (8.2) |
|
|
Mild (2–4) |
3,112 (31.9) |
2,775 (33.8) |
337 (21.8) |
|
|
Moderate (5–8) |
3,788 (38.8) |
3,181 (38.7) |
607 (39.3) |
|
|
Severe (9–12) |
1,628 (16.7) |
1,153 (14.0) |
475 (30.7) |
|
|
PNI score |
39.6 (33.8–46.4) |
40.2 (34.5–46.8) |
35.9 (30.1–43.5) |
<0.001 |
|
PNI category |
|
|
|
<0.001 |
|
Absent (>38) |
5,580 (57.2) |
4,942 (60.1) |
638 (41.3) |
|
|
Moderate (35–38) |
1,253 (12.8) |
1,064 (12.9) |
189 (12.2) |
|
|
Severe (<35) |
2,930 (30.0) |
2,211 (26.9) |
719 (46.5) |
|
|
Mechanically ventilated patients |
(n=2245) |
(n=1,643) |
(n=602) |
|
|
CONUT score |
4 (2–7) |
3 (1–6) |
5 (2–8) |
<0.001 |
|
CONUT category |
|
|
|
<0.001 |
|
Absent (0–1) |
529 (23.6) |
437 (26.6) |
92 (15.3) |
|
|
Mild (2–4) |
732 (32.6) |
566 (34.4) |
166 (27.6) |
|
|
Moderate (5–8) |
646 (28.8) |
447 (27.2) |
199 (33.1) |
|
|
Severe (9–12) |
338 (15.1) |
193 (11.7) |
145 (24.1) |
|
|
PNI score |
43.5 (35.4–54.6) |
44.2 (36.6–55.2) |
40.8 (31.9–52.7) |
<0.001 |
|
PNI category |
|
|
|
<0.001 |
|
Absent (>38) |
1,485 (66.1) |
1,150 (70.0) |
335 (55.6) |
|
|
Moderate (35–38) |
216 (9.6) |
154 (9.4) |
62 (10.3) |
|
|
Severe (<35) |
544 (24.2) |
339 (20.6) |
205 (34.1) |
|
Table 3.Cox’s proportional analyses of objective nutritional indices associated with 30-day mortality
|
Variable |
Univariate analysis HR (95% CI) |
P-value |
Multivariable analysis HR (95% CI) |
P-value |
|
Overall patients |
|
|
|
|
|
CONUT category |
|
|
|
|
|
Absent (0–1) |
1.0 (Reference) |
|
1.0 (Reference) |
|
|
Mild (2–4) |
1.06 (0.86–1.30) |
0.588 |
1.10 (0.90–1.36) |
0.355 |
|
Moderate (5–8) |
1.61 (1.33–1.94) |
<0.001 |
1.52 (1.24–1.87) |
<0.001 |
|
Severe (9–12) |
3.17 (2.61–3.86) |
<0.001 |
2.42 (1.95–3.02) |
<0.001 |
|
CONUT per 1-point increase |
1.15 (1.13–1.17) |
<0.001 |
1.10 (1.08–1.12) |
<0.001 |
|
PNI category |
|
|
|
|
|
Absent (>38) |
1.0 (Reference) |
|
1.0 (Reference) |
|
|
Moderate (35-38) |
1.34 (1.14–1.58) |
<0.001 |
1.29 (1.09–1.53) |
0.003 |
|
Severe (<35) |
2.31 (2.08–2.57) |
<0.001 |
1.88 (1.67–2.12) |
<0.001 |
|
PNI per 1-point increase |
0.97 (0.97–0.98) |
<0.001 |
0.98 (0.98–0.99) |
<0.001 |
|
Mechanically ventilated patients |
|
|
|
|
|
CONUT category |
|
|
|
|
|
Absent (0–1) |
1.0 (Reference) |
|
1.0 (Reference) |
|
|
Mild (2–4) |
1.34 (1.04–1.73) |
0.025 |
1.23 (0.94–1.60) |
0.126 |
|
Moderate (5–8) |
1.92 (1.50–2.46) |
<0.001 |
1.61 (1.23–2.11) |
0.001 |
|
Severe (9–12) |
2.87 (2.21–3.72) |
<0.001 |
2.04 (1.50–2.76) |
<0.001 |
|
CONUT per 1-point increase |
1.11 (1.08–1.13) |
<0.001 |
1.07 (1.04–1.10) |
<0.001 |
|
PNI category |
|
|
|
|
|
Absent (>38) |
1.0 (Reference) |
|
1.0 (Reference) |
|
|
Moderate (35-38) |
1.32 (1.01–1.74) |
0.042 |
1.37 (1.04–1.81) |
0.027 |
|
Severe (<35) |
1.81 (1.52–2.15) |
<0.001 |
1.47 (1.19–1.81) |
<0.001 |
|
PNI per 1-point increase |
0.99 (0.98–0.99) |
<0.001 |
0.99 (0.99–1.00) |
0.023 |
References
- 1. Singer M, Deutschman CS, Seymour CW, Shankar-Hari M, Annane D, Bauer M, et al. The third international consensus definitions for sepsis and septic shock (Sepsis-3). JAMA 2016;315:801-10.PubMedPMC
- 2. Bourke CD, Berkley JA, Prendergast AJ. Immune dysfunction as a cause and consequence of malnutrition. Trends Immunol 2016;37:386-98.ArticlePubMedPMC
- 3. Kalantar-Zadeh K, Kopple JD, Block G, Humphreys MH. A malnutrition-inflammation score is correlated with morbidity and mortality in maintenance hemodialysis patients. Am J Kidney Dis 2001;38:1251-63.ArticlePubMed
- 4. Kim SJ, Lee HY, Choi SM, Lee SM, Lee J. Comparison of mNUTRIC-S2 and mNUTRIC scores to assess nutritional risk and predict intensive care unit mortality. Acute Crit Care 2022;37:618-26.ArticlePubMedPMCPDF
- 5. Onodera T, Goseki N, Kosaki G. Prognostic nutritional index in gastrointestinal surgery of malnourished cancer patients. Nihon Geka Gakkai Zasshi 1984;85:1001-5.PubMed
- 6. Ignacio de Ulíbarri J, González-Madroño A, de Villar NG, González P, González B, Mancha A, et al. CONUT: a tool for controlling nutritional status. First validation in a hospital population. Nutr Hosp 2005;20:38-45.
- 7. Gul B, Metintas S, Ak G, Yilmaz S, Metintas M. The relationship between nutritional status and prognosis in patients with locally advanced and advanced stage lung cancer. Support Care Cancer 2021;29:3357-65.ArticlePubMedPDF
- 8. Wang Z, Wang Y, Zhang X, Zhang T. Pretreatment prognostic nutritional index as a prognostic factor in lung cancer: review and meta-analysis. Clin Chim Acta 2018;486:303-10.ArticlePubMed
- 9. Di Vincenzo O, Luisi ML, Alicante P, Ballarin G, Biffi B, Gheri CF, et al. The assessment of the risk of malnutrition (undernutrition) in stroke patients. Nutrients 2023;15:683. ArticlePubMedPMC
- 10. Han X, Cai J, Li Y, Rong X, Li Y, He L, et al. Baseline objective malnutritional indices as immune-nutritional predictors of long-term recurrence in patients with acute ischemic stroke. Nutrients 2022;14:1337. ArticlePubMedPMC
- 11. Ardehali SH, Eslamian G, Malek S. Associations between systemic inflammation and intestinal permeability with Onodera's prognostic nutritional index in critically ill patients. Acute Crit Care 2021;36:361-8.ArticlePubMedPMCPDF
- 12. Koontalay A, Suksatan W, Sadang JM, Prabsangob K. Optimal nutritional factors influencing the duration of mechanical ventilation among adult patients with critical illnesses in an intensive care unit. J Multidiscip Healthc 2021;14:1385-93.ArticlePubMedPMC
- 13. Rhee C, Kadri S, Huang SS, Murphy MV, Li L, Platt R, et al. Objective sepsis surveillance using electronic clinical data. Infect Control Hosp Epidemiol 2016;37:163-71.ArticlePubMedPMC
- 14. Bone RC, Balk RA, Cerra FB, Dellinger RP, Fein AM, Knaus WA, et al. Definitions for sepsis and organ failure and guidelines for the use of innovative therapies in sepsis. Chest 1992;101:1644-55.ArticlePubMed
- 15. Evans L, Rhodes A, Alhazzani W, Antonelli M, Coopersmith CM, French C, et al. Surviving sepsis campaign: international guidelines for management of sepsis and septic shock 2021. Intensive Care Med 2021;47:1181-247.PubMedPMC
- 16. Kondrup J, Allison SP, Elia M, Vellas B, Plauth M, Clinical Practice Committee; et al. ESPEN guidelines for nutrition screening 2002. Clin Nutr 2003;22:415-21.ArticlePubMed
- 17. McClave SA, DiBaise JK, Mullin GE, Martindale RG. ACG clinical guideline: nutrition therapy in the adult hospitalized patient. Am J Gastroenterol 2016;111:315-34.ArticlePubMedPDF
- 18. Kondrup J, Rasmussen HH, Hamberg O, Stanga Z, Ad Hoc ESPEN Working Group. Nutritional risk screening (NRS 2002): a new method based on an analysis of controlled clinical trials. Clin Nutr 2003;22:321-36.ArticlePubMed
- 19. Gao Q, Cheng Y, Li Z, Tang Q, Qiu R, Cai S, et al. Association between nutritional risk screening score and prognosis of patients with sepsis. Infect Drug Resist 2021;14:3817-25.ArticlePubMedPMCPDF
- 20. Heyland DK, Dhaliwal R, Jiang X, Day AG. Identifying critically ill patients who benefit the most from nutrition therapy: the development and initial validation of a novel risk assessment tool. Crit Care 2011;15:R268. ArticlePubMedPMC
- 21. Wełna M, Adamik B, Kübler A, Goździk W. The NUTRIC score as a tool to predict mortality and increased resource utilization in intensive care patients with sepsis. Nutrients 2023;15:1648. ArticlePubMedPMC
- 22. Wu H, Zhou C, Kong W, Zhang Y, Pan D. Prognostic nutrition index is associated with the all-cause mortality in sepsis patients: a retrospective cohort study. J Clin Lab Anal 2022;36:e24297. ArticlePubMedPMCPDF
- 23. Kyo D, Tokuoka S, Katano S, Hisamune R, Yoshimoto H, Murao S, et al. Comparison of nutrition indices for prognostic utility in patients with sepsis: a real-world observational study. Diagnostics (Basel) 2023;13:1302. ArticlePubMedPMC
- 24. Elke G, Hartl WH, Kreymann KG, Adolph M, Felbinger TW, Graf T, et al. Clinical nutrition in critical care medicine: guideline of the German Society for Nutritional Medicine (DGEM). Clin Nutr ESPEN 2019;33:220-75.ArticlePubMed
- 25. Khalid I, Doshi P, DiGiovine B. Early enteral nutrition and outcomes of critically ill patients treated with vasopressors and mechanical ventilation. Am J Crit Care 2010;19:261-8.ArticlePubMed
- 26. Al Tamimi D, Ahmad M. Risk of malnutrition and clinical outcomes among mechanically ventilated patients in intensive care units. Dimens Crit Care Nurs 2022;41:18-23.ArticlePubMed
- 27. Cha JK, Kim HS, Kim EJ, Lee ES, Lee JH, Song IA. Effect of early nutritional support on clinical outcomes of critically ill patients with sepsis and septic shock: a single-center retrospective study. Nutrients 2022;14:2318. ArticlePubMedPMC
- 28. Bernardi M, Maggioli C, Zaccherini G. Human albumin in the management of complications of liver cirrhosis. Crit Care 2012;16:211. ArticlePubMedPMCPDF
Citations
Citations to this article as recorded by


 , Young Suk Kwon2,3

 PubReader
 ePub Link
 Cite
Cite