Abstract
-
Background
- Delayed intubation is associated with poor prognosis in patients with respiratory failure. However, the effect of delayed intubation in patients with idiopathic pulmonary fibrosis (IPF) remains unknown. This study aimed to analyze whether timing of intubation after high-concentration oxygen therapy was associated with worse clinical outcomes in IPF patients.
-
Methods
- This retrospective propensity score-matched study enrolled adult patients with IPF who underwent mechanical ventilation between January 2011 and July 2021. Patients were divided into early and delayed intubation groups. Delayed intubation was defined as use of high-concentration oxygen therapy for at least 48 hours before tracheal intubation. The primary outcome was intensive care unit (ICU) mortality, and a conditional logistic regression model was used to evaluate the association between timing of intubation and clinical outcomes.
-
Results
- The median duration of high-concentration oxygen therapy before intubation was 0.5 days in the early intubation group (n=60) and 5.1 days in the delayed intubation group (n=36). The ICU mortality rate was 56.7% and 75% in the early and delayed intubation groups, respectively, before propensity matching (P=0.075). After matching for demographic and clinical covariates, 33 matched pairs were selected. In the propensity-matched cohort, delayed intubation significantly increased the risk of ICU mortality (adjusted odds ratio, 3.99; 95% confidence interval, 1.02–15.63; P=0.046). However, in-hospital mortality did not differ significantly between the groups.
-
Conclusions
- In patients with IPF, delayed intubation after initiation of high-concentration oxygen therapy was significantly associated with increased risk of ICU mortality compared to early intubation.
-
Keywords: idiopathic pulmonary fibrosis; intubation; mortality
INTRODUCTION
Idiopathic pulmonary fibrosis (IPF) is a chronic, progressive, and fibrosing interstitial pneumonia of unknown cause. The prevalence of IPF was 2–29 cases per 100,000 in the general population [1]. IPF has a poor prognosis and limited treatment options. According to the American Thoracic Society (ATS) guidelines, antifibrotic drugs such as pirfenidone and nintedanib are recommended to treat IPF; corticosteroids may be helpful during acute exacerbation of IPF [1,2]. Lung transplantation (TPL) is strongly recommended for patients having IPF with a progressively incurable nature.
Mechanical ventilation is not recommended due to the high mortality associated with mechanical ventilation in patients with IPF (approximately 80–90%) [3,4]. In a minority of cases, however, mechanical ventilation is reasonable [1]. In some patients with IPF, invasive mechanical ventilation can be implemented as a bridge to lung TPL [5,6]. Recently, with the development of critical medical care, the rate of mechanical ventilation in patients with IPF has gradually increased. According to a previous study, the number of patients with IPF with respiratory failure that required mechanical ventilation increased by 61% from 5.9 per 100,000 hospitalizations in 2013 to 9.5 per 100,000 hospitalizations in 2017 [7]. Although the use of mechanical ventilation is increasing in IPF patients, there are no precise guidelines for optimizing both patient selection and timing of intubation in IPF patients with respiratory failure.
With the development of oxygen therapy for improving patient oxygenation, high-flow oxygen therapy, such as through the use of a high-flow nasal cannula (HFNC), could reduce the need for tracheal intubation [8]. However, use of HFNC in patients with respiratory failure may delay intubation and worsen the clinical outcomes [9]. Delayed intubation showed a poor prognosis in a study of patients with acute respiratory distress syndrome (ARDS) [10]. However, these studies analyzed patients with respiratory failure, including those with several etiologies. The association between timing of tracheal intubation and clinical prognosis may differ depending on the cause of respiratory failure. Furthermore, few studies on the effect of intubation timing on clinical outcomes in patients with IPF have been attempted. Therefore, this study aimed to analyze the association between timing of intubation and clinical outcomes in patients with IPF who require invasive mechanical ventilation after starting high-concentration oxygen therapy.
MATERIALS AND METHODS
Study Design and Population
Our retrospective observational study included adult patients (>19 years) diagnosed with IPF who were admitted to the intensive care unit (ICU) and received mechanical ventilation from January 2011 to July 2021. Patients diagnosed with IPF according to the ATS guidelines [11] and who received high-concentration oxygen therapy before intubation were enrolled and followed up until hospital discharge or death. Patients aged <19 years, admitted to the ICU but not undergoing intubation, admitted to the ICU for surgery such as lung TPL, transferred after oxygen therapy or tracheal intubation at another hospital, and who underwent tracheal intubation upon arrival at the hospital were excluded from the study. This study was conducted at a single tertiary university-affiliated hospital in accordance with the Declaration of Helsinki. The Institutional Review Board of Seoul National University Hospital waived the requirement for written informed consent due to the retrospective nature of the study and approved this study (No. IRB-H-2106-185-1230).
Definitions and Data Collection
High-concentration oxygen therapy was defined as delivery of a greater than 40% fraction of inspired oxygen (FiO2) or 5 L/min or more via a nasal prong. When oxygen is delivered through a nasal prong, FiO2 increases by approximately 4% for every additional liter of oxygen administered per minute [12]. According to a previous study on HFNC [9], early intubation was defined as tracheal intubation within 48 hours of initiating high-concentration oxygen therapy, and delayed intubation was defined as tracheal intubation 48 hours after initiation of high-concentration oxygen therapy.
Data collected on the index date (i.e., date of tracheal intubation) were age, sex, body mass index (BMI), comorbidities, and etiologies of respiratory failure. Pulmonary function data were collected on the day nearest to intubation. The GAP score that considers gender [G], age [A], and two pulmonary physiological parameters [P] (forced vital capacity [FVC, %] and diffusing capacity for carbon monoxide) was calculated using the method suggested by Ley et al. [13]; and the GAP stage was classified according to the GAP score (stage I, score 0–3; stage II, 4–5; stage III, score 6–8). We reviewed the initial vital signs, laboratory findings within 24 hours before and after intubation, and duration of high-concentration oxygen therapy. Hypercapnic respiratory failure was characterized by a partial pressure of carbon dioxide in alveolar gas (PaCO2) higher than 50 mm Hg. The ratio of oxygen saturation (ROX) index was defined as the ratio of pulse oximetry/FiO2 to respiratory rate [14]. The parameters of mechanical ventilation within 24 hours of intubation were reviewed, and the median values of ventilator parameters were used for statistical analysis. Additional data collected during the ICU stay included use of adjunctive therapies such as vasoactive agents, inotropic agents, analgesics, sedatives, and neuromuscular blockers within 48 hours of tracheal intubation. Medical treatments in the ICU, including antifibrotic agents and systemic steroids, were reviewed. Steroid pulse therapy is defined as a short-term intravenous injection (usually 3 days) of high-dose (5–20 mg/kg) methylprednisolone or an equivalent dose of another steroid. Lung-transplant-free survival was defined as survival free of death or lung transplantation during hospitalization.
Study Outcomes
The primary outcome was the comparison of ICU mortality between early and delayed intubation groups in patients with IPF. The secondary outcomes were in-hospital mortality, 28-day mortality, and lung-transplant-free survival in the ICU and in-hospital. Data on ICU length of stay (LOS), hospital LOS, and discharge location to home or to other hospital were also collected.
Statistical Analysis
To minimize selection bias and control variables that might affect the results, we used the propensity score as a balancing score to adjust for confounding variables. This allowed accurate determination of the presence or absence of an association between timing of intubation and clinical outcome in patients with IPF [14,15]. The propensity score for timing of intubation was estimated using a multivariable logistic regression model with baseline covariates of age, gender, BMI, comorbidities, GAP stage, cause of respiratory failure, treatment for IPF, previous home oxygenation therapy, and Sequential Organ Failure Assessment (SOFA) score after intubation [14]. The early and delayed intubation groups were matched according to propensity score using a 1:1 nearest neighbor strategy without replacement and an optimal caliper of 0.1 standard deviation of the propensity score [15,16]. The quality of matching was assessed using the standardized mean difference, and matched patients were considered in the analysis of study results.
Baseline and clinical characteristics of patients with IPF according to timing of intubation were compared using the Wilcoxon rank-sum test for continuous variables. Categorical variables were compared using the chi-square test or Fisher's exact test. Clinical characteristics, laboratory findings before and after intubation, and parameters of mechanical ventilation after intubation were analyzed in the same way.
After propensity score matching, the Wilcoxon signed-rank sum test for continuous variables and McNemar's test for categorical variables were performed. Conditional logistic regression was used to evaluate the association between intubation timing and clinical outcomes with adjustment for key prognostic factors (age, SOFA score, and FVC). The propensity score model and the outcome regression model were combined to construct a doubly robust estimator that provides an estimation of the treatment effect for the primary outcome protected against possible model misspecification [17-19]. Statistical significance was set at P<0.05. Statistical analyses were performed using the R 4.0.2 software (R Foundation for Statistical Computing, Vienna, Austria; http://www.r-project.org) and Stata 13.1 software (StataCorp., College Station, TX, USA).
RESULTS
Baseline Demographics and Clinical Characteristics
During the study period, 173 patients with IPF were admitted to the ICU. After excluding 77 patients who were not intubated (n=15), intubated upon arrival (n=4), transferred after oxygen supplied or intubation performed at another hospital (n=11), admitted for lung transplant (n=21) or other surgeries (n=23), and younger than 19 years (n=3), 96 patients were included in this study (Figure 1). Before propensity score matching, 60 (62.5%) patients were in the early intubation group and 36 patients (37.5%) in the delayed intubation group. The baseline and clinical characteristics of the two groups before propensity score matching are shown in Table 1.
After propensity score estimation and matching in a 1:1 ratio, 33 matched pairs of patients were identified. The matched patients had a median age of 69 (interquartile range [IQR], 64–75), and most were male (n=48, 72.3%). Eight (12.1%) patients with IPF had a history of other respiratory diseases such as chronic obstructive lung disease, nontuberculous mycobacterial lung disease, or asthma. Acute exacerbation of IPF or pneumonia was the most common cause of hospitalization (n=59, 89.4%).
Oxygenation Therapy before and after Intubation
In the entire cohort, the median duration of high-concentration oxygen therapy before intubation was 0.5 days (IQR, 0.0–1.0) in the early intubation group and 5.1 days (IQR, 3.1–16.4) in the delayed intubation group. Total duration of oxygen therapy before intubation was longer in the delayed intubation group (13.1 days; IQR, 4.5–28.5) than in the early intubation group (1.1 days; IQR, 0.3–2.2) (P<0.001) (Table 2). Prevalence of home oxygen therapy maintenance before admission was 36.7% in the early intubation group and 41.7% in the delayed intubation group; the difference was not statistically significant (P=0.787). However, the median home oxygen flow was significantly higher in the delayed intubation group (3.0 L/min; IQR, 2.5–5.0) than in the early intubation group (2.0 L/min; IQR, 2.0–4.0) (P=0.040) (Table 2). After hospitalization, HFNC use was significantly greater in the delayed intubation group (80.6%) than the early intubation group (48.3%) (P=0.004) (Table 2).
Before intubation, PaCO2 was significantly higher in the delayed intubation group (41.0 mm Hg; IQR, 36.8–50.2) than in the early intubation group (37.0 mm Hg; IQR, 32.3–42.5) (P=0.009) (Supplementary Table 1). Moreover, after propensity score matching, the proportion of hypercapnic respiratory failures before intubation was significantly higher in the delayed intubation group (28.1%) than in the early intubation group (10.3%) (P=0.025) (Supplementary Table 1). However, PaO2/FiO2 ratio and the ROX index were not significantly different between the two groups (P=0.442 and P=0.594, respectively) (Supplementary Table 1).
After tracheal intubation, there were no significant differences between the two groups in the initial mode of mechanical ventilation within 24 hours after intubation. However, after propensity score matching, the median positive end-expiratory pressure (PEEP) was significantly lower in the delayed intubation group, 5.0 cm H2O (IQR, 5.0–7.0), than in the early intubation group, 8.0 cm H2O (IQR, 7.0–10.0) (P=0.005) (Table 3). Minute ventilation was not significantly different, 11.2 L/min (IQR, 9.2–13.2) in the early intubation group and 12.8 L/min (IQR, 10.0–14.4) in the delayed intubation group (P=0.260). Saturation within 24 hours after intubation was 95% (IQR, 93%–97%) in the early intubation group and 95% (IQR, 92%–98%) in the delayed intubation group (P=0.695) (Supplementary Table 2).
Clinical Outcomes in the Propensity-Matched Patient Groups
Before propensity score matching, ICU mortality was 56.7% (n=34) in the early intubation group and 75% (n=27) in the delayed intubation group, without significant difference (P=0.075) (Supplementary Table 3). However, after propensity score matching with adjustment for various confounding variables that may affect clinical results, ICU mortality was significantly higher in the delayed intubation group than in the early intubation group (adjusted odds ratio [OR], 3.99; 95% confidence interval [CI], 1.02–15.63; P=0.046) (Table 4). However, in-hospital mortality did not show a significant difference between the two groups, 75.8% in 25 patients in each group (adjusted OR, 1.08; 95% CI, 0.34–3.46). Additionally, there was no significant difference in 28-day mortality (adjusted OR, 1.39; 95% CI, 0.43–4.44) (P>0.05 for each).
More patients in the delayed intubation group (21.2%) received lung TPL than in the early group (12.1%); however, the difference was not significant (P=0.257) (Supplementary Table 4). The lung–transplant–free survival rate in the ICU was higher in the early intubation group (36.4%) than in the delayed intubation group (6.1%) (P=0.003). Furthermore, the lung–transplant–free in-hospital survival rate tended to be higher in the early intubation group (15.2%) than in the delayed intubation group (6.1%) (P=0.299) (Table 4).
When ICU LOS was analyzed for 24 ICU survivors, there were no significant differences between the two groups, with a median of 12.0 days (IQR, 8.2–24.2) and 11.7 days (IQR, 9.9–17.9) in the early intubation and delayed intubation groups, respectively (P=0.951). Additionally, there was no significant difference between the two groups when the hospital LOS of 16 in-hospital survivors was analyzed (early vs. delayed intubation group: 84.9 days [IQR, 41.4–107.4] vs. 57.5 days [IQR, 40.5–89.2], respectively, P=0.401) (Table 4).
DISCUSSION
In this retrospective propensity score-matched cohort study of patients with IPF, ICU mortality was significantly higher in the delayed intubation group, defined as tracheal intubation 48 hours after initiation of high-concentration oxygen therapy, than the early intubation group. However, there were no significant differences in in-hospital or 28-day mortality.
In recent studies, the in-hospital mortality rate of patients with IPF receiving mechanical ventilation was high, 50%–75% [20,21], but was lower than the previous report of 80%–90% [3,4,22]. In our study, in-hospital mortality of patients who received mechanical ventilation was 76%, similar to that of the recent results. For this reason, mechanical ventilation is not recommended in patients with IPF [1]. The potential extension of life offered by mechanical ventilation should be carefully weighed, particularly in IPF patients with worse prognostic factors, such as older age, decreased lung function, and pre-existing clinical frailty, and those with no further curative treatment options [20,23,24]. However, intubation may be considered in some patients with IPF when lung TPL is being considered. Nevertheless, the appropriate timing of intubation in patients with respiratory failure remains controversial.
Few studies have been conducted on the use of intubation in patients with IPF with respiratory failure. In a previous study, ICU mortality was significantly higher in critically ill patients who received delayed intubation more than 2 days after admission to the ICU (early vs. delayed intubation: 18.2 vs. 27.6%, P=0.007). Hospital mortality was also higher in patients with delayed intubation (23.4 vs. 33.3%, respectively, P=0.008) than in those with early intubation [25]. Furthermore, when HFNC was applied for respiratory failure and intubation was performed after HFNC failure, ICU mortality was significantly lower in early intubation (intubation within 48 hours of HFNC) than in delayed intubation (intubation after 48 hours of HFNC) (propensity-matched OR, 0.369; 95% CI, 0.139–0.984; P=0.046) [9]. In this present study, as in a previous study on patients with ARDS or respiratory failure, ICU mortality was significantly higher in patients with IPF who underwent delayed intubation at least 48 hours after high-oxygen concentration therapy.
HFNC is comfortable to use with humidified, warm air and provides a low PEEP effect. Some studies revealed that HFNC could reduce the intubation rate with acute hypoxemic respiratory failure [26,27]. Furthermore, high-concentration oxygen therapy is also maintained with nasal prongs or facial masks in clinical practice. However, considering the results of our and previous studies, delaying tracheal intubation after failure of high-concentration oxygen therapy in patients with IPF is not advised. This is particularly true for cases in which lung TPL is being considered. Spontaneous breathing before intubation in patients with acute respiratory failure may involve a high respiratory drive and large tidal volumes that lead to transpulmonary pressure swings [28,29]. Delayed intubation may exacerbate lung damage caused by spontaneous breathing in patients with IPF, which may lead to hypercapnic respiratory failure and increased ICU mortality.
Our data showed no statistical differences in in-hospital and 28-day mortality, which is consistent with a previous study in patients with HFNC failure [9]. However, although not statistically significant, in-hospital survival rate without lung TPL was higher in the early intubation group. The study may not have had sufficient power to detect a clinically important difference. Therefore, further studies with larger numbers of patients are needed.
Our study has several strengths. Lung function in patients with IPF significantly influences clinical prognosis [6]. In this study, actual data from pulmonary function tests was collected, and propensity score matching was performed considering the patient’s lung function. Furthermore, this study included patients who received high-concentration oxygen therapy with nasal prongs, facial masks, and HFNC. HFNC has been widely used as an efficient oxygen supply in patients with respiratory failure. However, in actual clinical practice, nasal prongs and facial masks are also widely used due to lack of equipment, patient discomfort, and differences in in-hospital systems. Therefore, this study well reflects the actual clinical situation. However, there are study limitations to consider to properly evaluate the results. First, the number of patients was small because the prevalence of IPF was low, and the study was conducted in a single institution. Second, as this was conducted in a single tertiary university-affiliated hospital, selection bias may have been introduced. Third, the patients had multiple comorbidities, such as malignancy, which increased the severity of clinical outcomes. Fourth, since the oxygen concentration was calculated as FiO2 4% per 1 L of O2 in patients using a nasal prong or facial mask, the actual oxygen concentration may not be accurately reflected. Furthermore, due to the retrospective nature of the study, not all dependent variables were controlled. However, propensity score matching was used to control variables that may affect patient prognosis. Finally, the reason for tracheal intubation in IPF patients was not collected in our study. Further study on the indications for tracheal intubation as well as timing of tracheal intubation is needed.
In conclusion, in this study of patients with IPF that required mechanical ventilation, delayed intubation after 48 hours of high-concentration oxygen therapy was significantly associated with increased risk of ICU mortality compared with early intubation. Therefore, as with other causes of respiratory failure, tracheal intubation should not be delayed if needed in IPF patients who have failed high-concentration oxygen therapy, especially when lung TPL is being considered.
KEY MESSAGES
▪ Although delayed intubation is associated with poor prognosis in patients with respiratory failure, the effect of delayed intubation in patients with idiopathic pulmonary fibrosis (IPF) remains unknown.
▪ Delayed intubation, defined as use of high-concentration oxygen therapy for at least 48 hours before tracheal intubation, was significantly associated with increased risk of intensive care unit mortality compared to early intubation in patients with IPF that required mechanical ventilation.
▪ As with other causes of respiratory failure, tracheal intubation should not be delayed if needed in IPF patients who have failed high-concentration oxygen therapy, especially when lung transplantation is being considered.
NOTES
-
CONFLICT OF INTEREST
No potential conflict of interest relevant to this article was reported.
-
AUTHOR CONTRIBUTIONS
Conceptualization: all authors. Data curation: EB. Formal analysis: EB, HYL. Methodology: all authors. Project administration: EB, HYL. Visualization: EB, HYL. Writing–original draft: EB, HYL. Writing–review & editing: all authors.
SUPPLEMENTARY MATERIALS
Supplementary materials can be found via https://doi.org/10.4266/acc.2022.00444.
Supplementary Table 2.
Laboratory findings and clinical characteristics in patients with IPF according to the timing of intubation
acc-2022-00444-suppl2.pdf
Figure 1.Flowchart of study patients. IPF: idiopathic pulmonary fibrosis; ICU: intensive care unit.
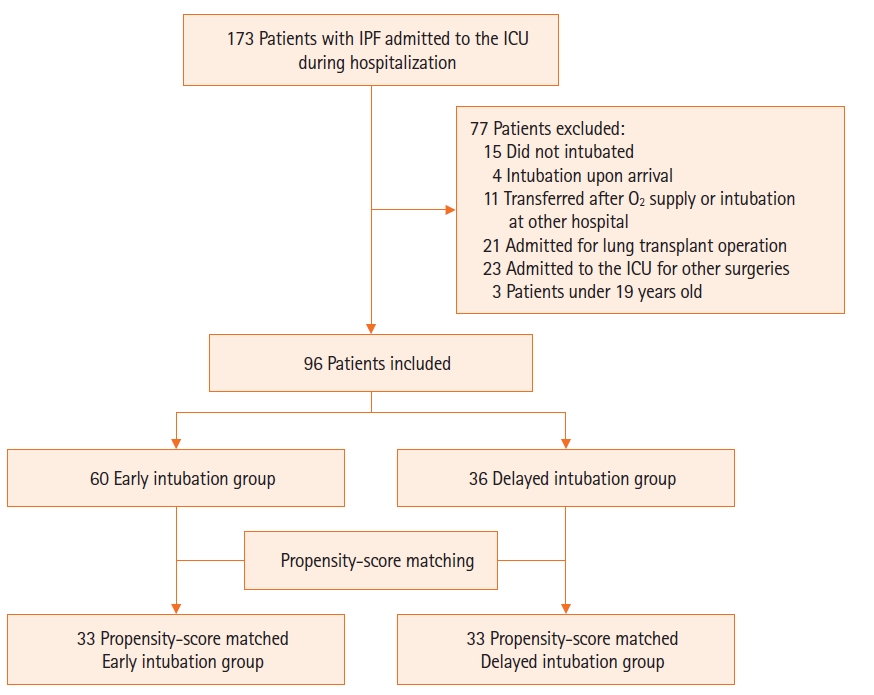
Table 1.Baseline and clinical characteristics of patients with IPF according to the timing of intubation
|
Variable |
Before matching
|
After matching
|
|
Early intubation group (n=60) |
Delayed intubation group (n=36) |
P-value |
Early intubation group (n=33) |
Delayed intubation group (n=33) |
P-value |
|
Demographics |
|
|
|
|
|
|
|
Male |
42 (70.0) |
28 (77.8) |
0.553 |
23 (69.7) |
25 (75.8) |
0.593 |
|
Age (yr) |
73 (68–77) |
66 (60–75) |
0.006 |
71 (68–75) |
66 (61–75) |
0.048 |
|
BMI (kg/m2) |
23.0 (19.5–25.1) |
21.4 (19.3–24.1) |
0.329 |
23.0 (20.7–25.4) |
21.4 (19.3–24.1) |
0.491 |
|
Cause of respiratory failure |
|
|
|
|
|
|
|
Acute exacerbation of IPF or pneumonia |
54 (90.0) |
33 (91.7) |
0.999 |
29 (87.9) |
30 (90.9) |
0.655 |
|
Other diseases |
6 (10.0) |
3 (8.3) |
|
4 (12.1) |
3 (9.1) |
|
|
Comorbidity |
|
|
|
|
|
|
|
Cardiovascular disease |
34 (56.7) |
18 (50.0) |
0.672 |
17 (51.5) |
16 (48.5) |
0.827 |
|
Other respiratory diseases |
8 (13.3) |
5 (13.9) |
0.999 |
4 (12.1) |
4 (12.1) |
0.999 |
|
Diabetes mellitus |
22 (36.7) |
9 (25.0) |
0.338 |
9 (27.3) |
8 (24.2) |
0.782 |
|
Chronic liver disease |
3 (5.0) |
0 (0.0) |
0.289 |
0 |
0 |
- |
|
Chronic kidney disease |
10 (16.7) |
3 (8.3) |
0.359 |
3 (9.1) |
2 (6.1) |
0.655 |
|
Solid cancer |
15 (25.0) |
8 (22.2) |
0.951 |
9 (27.3) |
8 (24.2) |
0.763 |
|
Hematologic cancer |
2 (3.3) |
0 |
0.526 |
1 (3.0) |
0 |
0.999 |
|
Spirometry |
|
|
|
|
|
|
|
FEV1/FVC |
85.1 (79.7–88.1) |
85.7 (81.9–90.7) |
0.563 |
83.8 (79.7–87.2) |
85.7 (81.9–90.7) |
0.264 |
|
FEV1 (% predicted) |
68.0 (59.0–81.0) |
67.5 (59.0–77.0) |
0.834 |
67.0 (56.0–79.0) |
67.0 (59.0–77.0) |
0.525 |
|
FVC (% predicted) |
57.0 (46.0–66.0) |
55.0 (46.0–66.0) |
0.902 |
55.0 (44.0–66.0) |
53.0 (46.0–66.0) |
0.427 |
|
DLco (% predicted) |
40.5 (33.0–56.0) |
41.0 (32.0–49.0) |
0.730 |
43.0 (29.0–57.0) |
40.5 (32.0–50.0) |
0.370 |
|
GAP stage |
|
|
0.147 |
|
|
0.422 |
|
Stage I |
4 (7.0) |
7 (20.6) |
|
3 (9.1) |
7 (21.2) |
|
|
Stage II |
27 (47.4) |
15 (44.1) |
|
19 (57.6) |
14 (42.4) |
|
|
Stage III |
26 (45.6) |
12 (35.3) |
|
11 (33.3) |
12 (36.4) |
|
|
Use of medication |
|
|
|
|
|
|
|
Anti-fibrotic agent |
17 (28.3) |
16 (44.4) |
0.165 |
15 (45.5) |
16 (48.5) |
0.819 |
|
Glucocorticoid |
13 (21.7) |
13 (36.1) |
0.192 |
9 (27.3) |
11 (33.3) |
0.564 |
|
Initial SOFA score |
6.0 (4.5–7.0) |
7.0 (5.0–8.5) |
0.165 |
6.0 (5.0–7.0) |
7.0 (5.0–8.0) |
0.834 |
Table 2.Oxygen therapy before intubation, before and after propensity score matching
|
Variable |
Before matching
|
After matching
|
|
Early intubation group (n=60) |
Delayed intubation group (n=36) |
P-value |
Early intubation group (n=33) |
Delayed intubation group (n=33) |
P-value |
|
Previous home oxygenation therapy |
|
|
|
|
|
|
|
By nasal cannula |
22 (36.7) |
15 (41.7) |
0.787 |
15 (45.5) |
15 (45.5) |
0.999 |
|
Home O2 flow (L/min) |
2.0 (2.0–4.0) |
3.0 (2.5–5.0) |
0.040 |
2.0 (2.0–4.0) |
3.0 (2.0–5.0) |
0.457 |
|
By noninvasive ventilator |
1 (1.7) |
0 |
0.999 |
0 |
0 |
|
|
O2 delivery system before intubation |
|
|
|
|
|
|
|
Nasal prong |
58 (96.7) |
36 (100.0) |
0.526 |
32 (97.0) |
33 (100.0) |
0.999 |
|
High-flow nasal cannula |
29 (48.3) |
29 (80.6) |
0.004 |
20 (60.6) |
26 (78.8) |
0.133 |
|
Noninvasive ventilator |
3 (5.0) |
1 (2.8) |
0.999 |
1 (3.0) |
1 (3.0) |
0.999 |
|
Duration of oxygen therapy before intubation |
|
|
|
|
|
|
|
Duration of low-concentration oxygen therapy (day) |
0.0 (0.0–1.9) |
0.0 (0.0–8.2) |
0.158 |
0.0 (0.0–1.4) |
0.0 (0.0–6.0) |
0.074 |
|
Duration of high-concentration oxygen therapy (day) |
0.5 (0.0–1.0) |
5.1 (3.1–16.4) |
<0.001 |
0.6 (0.2–1.0) |
5.1 (3.5–16.9) |
<0.001 |
|
Total duration of oxygen therapy (day) |
1.1 (0.3–2.2) |
13.1 (4.5–28.5) |
<0.001 |
1.3 (0.3–2.2) |
14.3 (4.8–29.4) |
<0.001 |
Table 3.Comparison of oxygenation status and parameters of mechanical ventilation after intubation before and after propensity score matching
|
Variable |
Before matching
|
After matching
|
|
Early intubation group (n=60) |
Delayed intubation group (n=36) |
P-value |
Early intubation group (n=33) |
Delayed intubation group (n=33) |
P-value |
|
ABGA within 24 hours of intubation |
|
|
|
|
|
|
|
Arterial pH |
7.33 (7.24–7.37) |
7.32 (7.26–7.35) |
0.815 |
7.30 (7.21–7.37) |
7.32 (7.26–7.36) |
0.362 |
|
PaCO2 (mm Hg) |
47.5 (39.0–56.8) |
48.8 (40.5–67.8) |
0.427 |
51.0 (42.0–57.6) |
49.0 (40.6–71.2) |
0.538 |
|
PaO2 (mm Hg) |
82.9 (70.9–111.5) |
86.5 (65.7–103.0) |
0.771 |
79.0 (69.7–115.0) |
86.0 (65.2–101.0) |
0.879 |
|
FiO2 (%) |
80 (60–95) |
90 (66–100) |
0.194 |
80 (65–90) |
80 (65–100) |
0.566 |
|
PaO2/FiO2 ratio |
115.5 (90.1–158.0) |
98.3 (75.8–157.6) |
0.300 |
116.2 (91.1–146.0) |
99.7 (77.2–162.5) |
0.846 |
|
Parameter of mechanical ventilator |
|
|
|
|
|
|
|
Initial ventilator mode |
|
|
0.999 |
|
|
0.999 |
|
PCV |
55 (91.7) |
33 (91.7) |
|
30 (90.9) |
30 (90.9) |
|
|
VCV |
1 (1.7) |
1 (2.8) |
|
1 (3.0) |
1 (3.0) |
|
|
PSV |
4 (6.7) |
2 (5.6) |
|
2 (6.1) |
2 (6.1) |
|
|
Pressure support (cm H2O) |
20.0 (15.0–23.0) |
22.0 (15.0–26.0) |
0.047 |
20.0 (15.5–22.5) |
22.5 (15.0–26.0) |
0.171 |
|
PEEP (cm H2O) |
7.5 (5.0–9.0) |
5.0 (5.0–7.0) |
0.005 |
8.0 (7.0–10.0) |
5.0 (5.0–7.0) |
0.005 |
|
PIP (cm H2O) |
28.2 (24.0–31.0) |
30.0 (25.5–31.5) |
0.320 |
29.0 (26.0–32.0) |
30.0 (26.0–31.0) |
0.779 |
|
FiO2 (%) |
80 (60–100) |
90 (66–100) |
0.246 |
80 (65–90) |
81 (65–100) |
0.632 |
|
Tidal volume (ml) |
407 (328–552) |
432 (356–532) |
0.639 |
400 (328–528) |
432 (352–528) |
0.865 |
|
Minute ventilation (L/min) |
11.2 (8.4–14.1) |
12.8 (9.6–14.4) |
0.126 |
11.2 (9.2–13.2) |
12.8 (10.0–14.4) |
0.260 |
Table 4.Primary and secondary outcomes in the propensity-matched cohort
|
Variable |
Early intubation group (n=33) |
Delayed intubation group (n=33) |
P-value |
Adjusted ORa) (95% CI) |
|
Primary outcome |
|
|
|
|
|
ICU mortality |
17 (51.5) |
25 (75.8) |
0.046 |
3.99 (1.02–15.63) |
|
Secondary outcome |
|
|
|
|
|
In-hospital mortality |
25 (75.8) |
25 (75.8) |
0.888 |
1.08 (0.34–3.46) |
|
28-Day mortality from intubation |
22 (66.7) |
23 (69.7) |
0.583 |
1.39 (0.43–4.44) |
|
Lung transplant-free survivalb)
|
|
|
|
|
|
In ICU |
12 (36.4) |
2 (6.1) |
0.003 |
|
|
In hospital |
5 (15.2) |
2 (6.1) |
0.299 |
|
|
Length of ICU stay (day) |
|
|
|
|
|
ICU survivor (n=24) |
12.0 (8.2–24.2) |
11.7 (9.9–17.9) |
0.951 |
|
|
ICU nonsurvivor (n=42) |
7.1 (3.0–13.9) |
7.6 (3.0–15.4) |
0.868 |
|
|
Length of hospital stay (day) |
|
|
|
|
|
In-hospital survivors (n=16) |
84.9 (41.4–107.4) |
57.5 (40.5–89.2) |
0.401 |
|
|
In–hospital nonsurvivor (n=50) |
12.0 (3.5–21.4) |
7.6 (3.0–15.4) |
0.491 |
|
|
Discharge (number/total)c)
|
|
|
0.282 |
|
|
To home |
4 (50.0) |
7 (87.5) |
|
|
|
To other hospitals |
4 (50.0) |
1 (12.5) |
|
|
References
- 1. Raghu G, Collard HR, Egan JJ, Martinez FJ, Behr J, Brown KK, et al. An official ATS/ERS/JRS/ALAT statement: idiopathic pulmonary fibrosis: evidence-based guidelines for diagnosis and management. Am J Respir Crit Care Med 2011;183:788-824.ArticlePubMedPMC
- 2. Raghu G, Rochwerg B, Zhang Y, Garcia CA, Azuma A, Behr J, et al. An official ATS/ERS/JRS/ALAT clinical practice guideline: treatment of idiopathic pulmonary fibrosis: an update of the 2011 clinical practice guideline. Am J Respir Crit Care Med 2015;192:e3-19.ArticlePubMed
- 3. Mollica C, Paone G, Conti V, Ceccarelli D, Schmid G, Mattia P, et al. Mechanical ventilation in patients with end-stage idiopathic pulmonary fibrosis. Respiration 2010;79:209-15.ArticlePubMedPDF
- 4. Mallick S. Outcome of patients with idiopathic pulmonary fibrosis (IPF) ventilated in intensive care unit. Respir Med 2008;102:1355-9.ArticlePubMed
- 5. Weill D, Benden C, Corris PA, Dark JH, Davis RD, Keshavjee S, et al. A consensus document for the selection of lung transplant candidates: 2014: an update from the Pulmonary Transplantation Council of the International Society for Heart and Lung Transplantation. J Heart Lung Transplant 2015;34:1-15.ArticlePubMed
- 6. Fernández Fabrellas E, Peris Sánchez R, Sabater Abad C, Juan Samper G. Prognosis and follow-up of idiopathic pulmonary fibrosis. Med Sci (Basel) 2018;6:51. ArticlePubMedPMC
- 7. Alqalyoobi S, Fernández Pérez ER, Oldham JM. In-hospital mortality trends among patients with idiopathic pulmonary fibrosis in the United States between 2013-2017: a comparison of academic and non-academic programs. BMC Pulm Med 2020;20:289. ArticlePubMedPMCPDF
- 8. Ni YN, Luo J, Yu H, Liu D, Ni Z, Cheng J, et al. Can high-flow nasal cannula reduce the rate of endotracheal intubation in adult patients with acute respiratory failure compared with conventional oxygen therapy and noninvasive positive pressure ventilation?: a systematic review and meta-analysis. Chest 2017;151:764-75.ArticlePubMed
- 9. Kang BJ, Koh Y, Lim CM, Huh JW, Baek S, Han M, et al. Failure of high-flow nasal cannula therapy may delay intubation and increase mortality. Intensive Care Med 2015;41:623-32.ArticlePubMedPDF
- 10. Kangelaris KN, Ware LB, Wang CY, Janz DR, Zhuo H, Matthay MA, et al. Timing of intubation and clinical outcomes in adults with acute respiratory distress syndrome. Crit Care Med 2016;44:120-9.ArticlePubMedPMC
- 11. Thomson CC, Duggal A, Bice T, Lederer DJ, Wilson KC, Raghu G. 2018 Clinical practice guideline summary for clinicians: diagnosis of idiopathic pulmonary fibrosis. Ann Am Thorac Soc 2019;16:285-90.PubMed
- 12. Rengasamy S, Nassef B, Bilotta F, Pugliese F, Nozari A, Ortega R. Administration of supplemental oxygen. N Engl J Med 2021;385:e9. ArticlePubMed
- 13. Ley B, Ryerson CJ, Vittinghoff E, Ryu JH, Tomassetti S, Lee JS, et al. A multidimensional index and staging system for idiopathic pulmonary fibrosis. Ann Intern Med 2012;156:684-91.ArticlePubMed
- 14. Austin PC. A critical appraisal of propensity-score matching in the medical literature between 1996 and 2003. Stat Med 2008;27:2037-49.ArticlePubMed
- 15. D’Agostino RB Jr. Propensity score methods for bias reduction in the comparison of a treatment to a non-randomized control group. Stat Med 1998;17:2265-81.ArticlePubMed
- 16. Austin PC. Optimal caliper widths for propensity-score matching when estimating differences in means and differences in proportions in observational studies. Pharm Stat 2011;10:150-61.ArticlePubMedPMCPDF
- 17. Bang H, Robins JM. Doubly robust estimation in missing data and causal inference models. Biometrics 2005;61:962-73.ArticlePubMed
- 18. Li X, Shen C. Doubly robust estimation of causal effect: upping the odds of getting the right answers. Circ Cardiovasc Qual Outcomes 2020;13:e006065.PubMed
- 19. Leisman DE. Ten pearls and pitfalls of propensity scores in critical care research: a guide for clinicians and researchers. Crit Care Med 2019;47:176-85.ArticlePubMed
- 20. Schrader M, Sathananthan M, Jeganathan N. Patients with idiopathic pulmonary fibrosis admitted to the ICU with acute respiratory failure: a reevaluation of the risk factors and outcomes. J Intensive Care Med 2022;37:342-51.ArticlePubMedPDF
- 21. Kelly BT, Thao V, Dempsey TM, Sangaralingham LR, Payne SR, Teague TT, et al. Outcomes for hospitalized patients with idiopathic pulmonary fibrosis treated with antifibrotic medications. BMC Pulm Med 2021;21:239. ArticlePubMedPMCPDF
- 22. Blivet S, Philit F, Sab JM, Langevin B, Paret M, Guérin C, et al. Outcome of patients with idiopathic pulmonary fibrosis admitted to the ICU for respiratory failure. Chest 2001;120:209-12.ArticlePubMed
- 23. Lee HY, Lee J, Jung YS, Kwon WY, Oh DK, Park MH, et al. Preexisting clinical frailty is associated with worse clinical outcomes in patients with sepsis. Crit Care Med 2022;50:780-90.ArticlePubMed
- 24. Lee HY, Cho J, Kwak N, Lee J, Park YS, Lee CH, et al. Prognostic impact of malignant diseases in idiopathic pulmonary fibrosis. Sci Rep 2020;10:18260. ArticlePubMedPMCPDF
- 25. Bauer PR, Gajic O, Nanchal R, Kashyap R, Martin-Loeches I, Sakr Y, et al. Association between timing of intubation and outcome in critically ill patients: a secondary analysis of the ICON audit. J Crit Care 2017;42:1-5.ArticlePubMed
- 26. Park S. High-flow nasal cannula for respiratory failure in adult patients. Acute Crit Care 2021;36:275-85.ArticlePubMedPMCPDF
- 27. Ferreyro BL, Angriman F, Munshi L, Del Sorbo L, Ferguson ND, Rochwerg B, et al. Association of noninvasive oxygenation strategies with all-cause mortality in adults with acute hypoxemic respiratory failure: a systematic review and meta-analysis. JAMA 2020;324:57-67.ArticlePubMedPMC
- 28. Brochard L, Slutsky A, Pesenti A. Mechanical ventilation to minimize progression of lung injury in acute respiratory failure. Am J Respir Crit Care Med 2017;195:438-42.ArticlePubMed
- 29. Brochard L. Ventilation-induced lung injury exists in spontaneously breathing patients with acute respiratory failure: yes. Intensive Care Med 2017;43:250-2.ArticlePubMedPDF
Citations
Citations to this article as recorded by


 , Jimyung Park1

 PubReader
 ePub Link
 Cite
Cite

