1Department of Radiodiagnosis, Maulana Azad Medical College and Lok Nayak Hospital, New Delhi, India
2Department of Pediatrics, Maulana Azad Medical College and Lok Nayak Hospital, New Delhi, India
3Department of Pulmonary Medicine, Maulana Azad Medical College and Lok Nayak Hospital, New Delhi, India
Corresponding author: Aparna Murali Department of Radiodiagnosis, Maulana Azad Medical College, 2 Bahadur Shah Zafar Marg, Near Delhi Gate, Maulana Azad Medical College Campus, Balmiki Basti, Delhi 110002, India E-mail: aparnamurali31@gmail.com
• Received: June 24, 2022 • Revised: September 2, 2022 • Accepted: September 19, 2022
This is an Open Access article distributed under the terms of the Creative Commons Attribution Non-Commercial License (http://creativecommons.org/licenses/by-nc/4.0/) which permits unrestricted non-commercial use, distribution, and reproduction in any medium, provided the original work is properly cited.
Lung ultrasound is based on the analysis of ultrasound artifacts generated by the pleura and air within the lungs. In recent years, lung ultrasound has emerged as an important alternative for quick evaluation of the patient at the bedside. Several techniques and protocols for performing lung ultrasound have been described in the literature, with the most popular one being the Bedside Lung Ultrasound in Emergency (BLUE) protocol developed, which can be utilized to diagnose the cause of acute dyspnea at the bedside. We attempt to provide a simplified approach to understanding the physics behind the artifacts used in lung ultrasound, the imaging techniques, and the application of the BLUE protocol to diagnose the commonly presenting causes of acute dyspnea.
Traditionally, the role of chest ultrasound in the evaluation of dyspnea was limited to the diagnosis of pleural effusion and guiding interventions like thoracocentesis. Its major drawback was poor penetration of the ultrasound beam due to the overlying thoracic cage and air content within the lung which led to artifacts. The same artifacts were used by Lichtenstein to develop the principles of lung ultrasound. In 1996, Lichtenstein [1] proposed the Bedside Lung Ultrasound in Emergency (BLUE) protocol which was rejected repeatedly, before being finally accepted after 12 years. Today, the principles of the BLUE protocol in lung ultrasound in the critically ill (LUCI) provide a standardized and simplified technique for performing and interpreting lung ultrasound. Lung ultrasound is based on understanding and analyzing the existing acoustic artifacts. It has the advantages of being cost-effective, feasible with bedside availability, lack of ionizing radiation, and allowing real-time imaging. Furthermore, lung ultrasound has a short learning curve and has been found to give reproducible results.
Although the linear transducer is usually used for evaluating the pleura, lung ultrasound is widely performed with convex or micro convex transducers, the latter being preferred if available. The following pictorial review attempts to simplify the physics, technique, interpretation, and pitfalls in performing lung ultrasound. Written informed consent was taken from each patient for publication of images.
PHYSICS
Basic knowledge of physics behind the generation of ultrasound artifacts is essential for image interpretation and extrapolation in various lung pathologies. Normally, the transducer emits a short ultrasound pulse which is transmitted into the body and undergoes reflections and scatterings at various levels as it passes through the tissues. The echo signal thus generated, returns to the transducer and is used for image formation. The image formation is dependent on a few basic assumptions [2]: the ultrasound pulse travels in a straight line, the speed of sound in tissues is constant and the depth at which echo is generated is assumed to be determined by the time delay at which the echo signal is received by the probe. These assumptions by the machine form the basis for two of the most important artifacts used in lung ultrasound–A-lines and B-lines (Figure 1) [2,3].
TECHNIQUE
Lungs are voluminous organs, hence detection and localization of pathologies may seem challenging. Various techniques have been described for performing lung ultrasound, the most popular ones being those devised by Lichtenstein [1], Gargani and Volpicelli [4]. These protocols range from comprehensive 28-site scanning evaluation at multiple intercostal spaces in the anterolateral chest wall with/without additional posterior chest evaluation described by Jambrik et al. [5] to the simplified eight-zone scanning of the anterolateral chest wall as described by described by Gargani and Volpicelli [4]. A 14-zone focused thoracic scanning technique (Figure 2) of anterolateral and posterior chest by Laursen et al. [6] has also been described. These techniques are preferred in stable patients. Written informed consent was obtained from each patient for publication of images.
However, in the emergency setup, time is a crucial commodity. One of the principles of LUCI states that life-threatening disorders usually have an extensive projection. On this premise, Lichtenstein [1] defined six BLUE-points, much like the standard electrode placement in electrocardiogram (ECG), allowing a simplified, quick and standardized technique for evaluating a critically ill patient at the bedside. There are three BLUE-points (Figure 3), 2 on the anterior chest wall (upper & lower BLUE point) and 1 located semi posteriorly (posterolateral alveolar and/or pleural syndrome [PLAPS] point). This allows the detection of PLAPS, i.e., consolidation and/or pleural effusion. Although these points are standardized, the protocol allows for operator flexibility. The first step in performing lung ultrasound is localizing the “bat-sign” (Figure 4) [1]. This is an important landmark and must be visualized before analyzing any artifacts.
IMAGE INTERPRETATION
The BLUE protocol [1] provides lung ultrasound profiles with an algorithmic approach to assist in diagnosis of 6 common acute conditions causing dyspnea: pneumothorax (A’ profile), pneumonia (C profile, AB profile, B’ profile and A-no V-PLAPS profile), pulmonary edema (B profile), acute exacerbation of chronic obstructive pulmonary disease (COPD)/asthma (A-no V-no PLAPS profile), and pulmonary embolism (A-V profile).
A-Profile
The A-profile is defined by the presence of both lung sliding and A-lines on anterior scans, bilaterally. Sometimes one or two B-lines with lung sliding may also be seen and are also included under A-profile. The pleural line is a hyperechoic, nearly horizontal line visualized <1 cm deep to the ribs. It is constituted by the parietal and visceral pleura which are not normally seen separately and indicates the interface between the soft tissues of the chest wall and the lungs. The normal physiological movement of the lungs results in sliding of the visceral pleura against the motionless parietal pleura resulting in a twinkling, to-and-fro motion called “lung sliding” [8]. On M-mode, the “seashore” [8] sign is demonstrated (Figure 5).
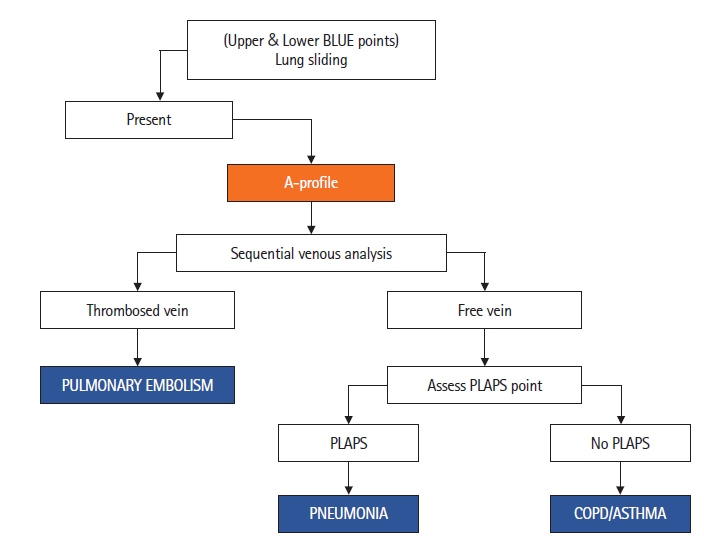
The A-profile can be used to diagnose three etiologies of dyspnea (Figure 6). Pulmonary embolism, pneumonia, and COPD/asthma. Firstly, history and clinical examination findings are taken into account while performing a sequential venous analysis to look for thrombosis. If thrombosed veins are visualized, a diagnosis of pulmonary embolism can be suggested. The presence of subpleural consolidations adds to the diagnostic value. If veins are not thrombosed, the PLAPS point is assessed. If pleural effusion and/or consolidation are detected, a diagnosis of pneumonia can be made. In absence of PLAPS, the most likely diagnosis is an acute exacerbation of COPD/asthma (Figure 7).
Zanobetti et al. [9] reported a sensitivity, specificity, positive predictive value, and negative predictive value of 86.8%, 96.1%, 89.7%, and 94.9% for the diagnosis of COPD/asthma by ultrasound. In the extended BLUE protocol [7], the physician performing the scan can extend the BLUE protocol at will and utilize clinical details suggestive of pulmonary embolism e.g. contraceptive pill use, chest pain, hemoptysis, deranged ECG, positive D-dimers, etc. if pulmonary embolism is suspected. Similarly, auscultation to hear wheezing can be done if there is a strong suspicion of COPD/asthma.
B-Profile
The presence of three or more B-lines in one longitudinal scan, disseminated to the anterior chest wall bilaterally with preserved lung sliding is called the B-profile. One must carefully assess a vertical artifact before calling it a B-line. The following are the features of a B-lines (Figure 8) as described by Lichtenstein [7]: (1) B-line is a comet tail artifact. (2) It always arises from the pleural line. (3) Always moves in synchrony with lung sliding. (4) Almost always long, spreading out without fading to edge of the screen. (5) Almost always erases A-lines. (6) Almost always hyperechoic.
Diffuse interstitial syndrome (Figure 9) is an ultrasound diagnosis defined by presence of multiple (three or more) B-lines in more than one scanning zone in the anterolateral chest wall, bilaterally [10]. In the critically ill, diffuse interstitial syndrome is almost always due to pulmonary edema, either hemodynamic (fluid overload or cardiogenic) and permeability induced (acute respiratory distress syndrome [ARDS]/post-infectious, etc.). The utility of B-lines in diagnosis and follow up of Interstitial lung diseases has been established in studies by several authors including Reissig and Kroegel [11], Gargani et al. [12], and Copetti et al. [13]. Reissig and Copetti [14] stated that appearance of the pleural line can be used as a criterion to differentiate pulmonary edema from Interstitial lung disease, with a regular pleural line seen in pulmonary edema. Buda et al. [15] defined several criteria for pulmonary fibrosis on lung ultrasound based on pleural line abnormalities including irregularity, tightening, fragmentary nature, blurring and thickening of the pleura line. Furthermore, Gargani [16] described the utility of lung ultrasound in differentiating pulmonary edema from ARDS on the basis of distribution of B-lines—homogenous, diffuse distribution is seen in pulmonary edema in contrast to non-homogenous distribution with areas of sparing noted in ARDS/acute lung injury. The latter also included additional sonographic findings like pleural alterations and consolidations of varying sizes.
Numerous descriptors are used for B-lines in literature [17], such as “lung rocket” pattern (3 B-lines), “septal rocket” pattern (4 B-lines) representing interlobular septal thickening and “ground glass rocket” pattern (>5 B-lines) representing ground glass areas on computed tomography. Scoring systems [18] have also been devised for semiquantitative assessment of lung aeration depending on number and proximity of B-lines.
A’-Profile
This profile is defined by abolished lung sliding at the anterior chest wall with the “A-line” sign. (1) Abolished lung sliding [8]: the presence of air between the parietal and visceral pleura in the case of pneumothorax results in a lack of lung sliding. This is further confirmed using the M-mode tracing which will display horizontal lines above and below the pleural line, known as the “barcode” or “stratosphere sign.” (2) “A-line” sign [17]: this refers to a pattern of exclusive A-lines with a complete absence of B-lines. The loss of B-lines is a result of air accumulating within the pleural space, eliminating the acoustic impedance gradient and thereby hindering the propagation of sound waves.
After establishing the A’ profile, the next step to confirm the diagnosis of pneumothorax is to detect the “lung point” sign (Figure 10) [19], which occurs at the border of pneumothorax due to the sliding lung intermittently coming into contact with the chest wall during inspiration. This is the confirmatory sign for establishing a diagnosis of pneumothorax (Figure 11) and helps in determining its size, which is important for clinical decision-making, as larger pneumothoraces are more likely to require thoracostomy. On M-mode, this sign is translated as alternating “seashore” and “stratosphere” patterns appearing over time when the probe is kept at a particular location. The more lateral or posterior the “lung-point sign” is identified, the larger the pneumothorax. According to Lichtenstein [1], the “Lung-point sign” is 100% specific for pneumothorax but with a relatively low sensitivity of 66% and is not seen in cases of total lung collapse. Various authors [20-22] have found that lung sliding is absent in many cases other than pneumothorax, including pleural effusions, ARDS, large consolidations, pulmonary fibrosis, pleural adhesions, atelectasis, right mainstem intubation, and phrenic nerve paralysis. Thus, lung sliding when used alone has a low specificity.
In the BLUE protocol, the terms used for lung consolidation are “Pneumonia” for anterior consolidation and posterolateral alveolar/pleural syndrome (PLAPS) for consolidation and/or pleural effusion in posterolateral lung zones. In the BLUE protocol [1], pneumonia is diagnosed by four profiles (Figure 12), namely C profile, AB profile, B’ profile and A-no V-PLAPS profile. Anterior consolidation is designated a “C-profile” (Figure 13) while posterolateral consolidation in a patient showing A-profile (lung sliding and A-lines) anteriorly is designated a “A-no V-PLAPS” profile (Figure 14). Unilateral lung-rockets are designated “A/B profile.” Diffuse, bilateral B-lines with loss of lung sliding is designated a “B’ profile.”
Four patterns of consolidation were described by Lichtenstein [1] to diagnose pneumonia. These included “non-translobar consolidation,” “translobar consolidation,” small subpleural consolidation identified by “C-line” and unilateral lung rocket pattern. To identify the “non-translobar” type of consolidation (Figure 15), presence of associated pleural effusion is first looked for by evidence of a regular lung line. This is done to avoid misdiagnosing a consolidation for an effusion. Traditionally, the diagnosis of pleural effusion is based on visualizing an anechoic/hypoechoic collection. This criterion is not advocated by the BLUE protocol, especially in critically ill patients with life-threatening collections like hemothorax and pyothorax and in challenging cases where difficulty in examination might create “parasite echoes” as described by Lichtenstein [7]. In the BLUE protocol, Lichtenstein [1] described the “lung line”, “quad sign” and “sinusoid sign,” as criteria for diagnosis of pleural effusion, disregarding the echogenicity of the collection (Figure 13).
The “Lung line” is a regular line which outlines the effusion, indicating the visceral pleural line, roughly parallel to the pleural line (parietal pleura). Thus, all effusions, anechoic or echoic, can be diagnosed using the lung line. Another useful sign is the “quad sign” which refers to the rough quadrilateral appearance of the effusion framed by the pleural line superiorly, visceral line inferiorly and rib shadows on either side. It is best demonstrated at the “PLAPS point” in a critically ill patient who has to be examined in a supine position.
A dynamic sign for diagnosing pleural effusion is the “sinusoid sign”. On M-mode, a “sinusoidal pattern” is noted due to movement of lung line towards the motionless pleural line on inspiration and downward movement on expiration, shaping a sinusoid. This sign is specific for pleural effusion. However, it is absent in very viscous or septate effusions. Moreover, since this sign indicates a low viscosity of fluid, the use of a narrow-gauge needle for thoracocentesis can be advised.
Apart from detecting pleural effusion, ultrasound can also determine the aeration status of underlying lung. In case of aerated, normal lung, short vertical echogenic lines, called the “Sub-B lines” may be visualized (Figure 13). On the contrary, a shredded margin or frank hepatisation/sonographic bronchograms denote underlying lung consolidation. Furthermore, a quantitative assessment of volume of pleural fluid can also be done using the BLUE-pleural index as highlighted by Lichtenstein [7]. This is done by measuring the interpleural distance at the PLAPS point and applying the correction factor in case of underlying lung consolidation. For example, 3 mm, 1 cm and 2 cm correspond to a “BLUE-pleural volume” of 15–30 ml, 75–150 ml, and 300–600 ml respectively.
CONCLUSION
Lung ultrasound is a useful imaging modality in the evaluation of dyspnea. With its non-invasive nature, easy availability, and lack of ionizing radiation, ultrasound is capable of diagnosing common respiratory pathologies causing dyspnea including pneumonia, pneumothorax, pulmonary edema, and acute exacerbation of COPD/severe asthma, apart from its traditional use in detecting pleural effusion. It has a short learning curve and when performed with the appropriate technique depending on the clinical scenario, it can assist in arriving at an accurate diagnosis at the bedside, allowing prompt management in critically ill patients.
KEY MESSAGES
▪ Lung Ultrasound is a useful tool, especially for bedside diagnosis of dyspnea in the acute and critical care setting.
▪ Lung ultrasound is based on analyzing the ultrasound artifacts generated, and applying the principles of the Bedside Lung Ultrasound in Emergency (BLUE) protocol to arrive at a diagnosis.
▪ Correlation with history and clinical findings at the bedside further adds to the diagnostic value of this quick and feasible technique.
Cine US clip demonstrating the sonographic appearance of a normal lung, identified by the landmarks forming the “bat sign”: two ribs with posterior acoustic shadowing representing the bat's wings, and the hyperechoic pleural line, its body. A-lines can be seen parallel to the pleural line. (https://doi.org/10.4266/acc.2022.00780.v001).
Supplementary Material 2.
Cine US clip demonstrating Lung sliding on M-mode with the cursor over the pleural line illustrating the “seashore sign.” The motionless portion of the chest above the pleural line creates horizontal “waves,” and the lung sliding below the pleural line creates a granular pattern, the “sand”. (https://doi.org/10.4266/acc.2022.00780.v002).
Supplementary Material 3.
Cine US clip showing 3 “B-lines”: comet-tail artifacts, always arising from the pleural line, and always moving in synchrony with lung-sliding. They are almost always long, well-defined, laser-like, hyperechoic, erasing A-lines, and are considered significant when ≥3. (https://doi.org/10.4266/acc.2022.00780.v003).
No potential conflict of interest relevant to this article was reported.
FUNDING
None.
ACKNOWLEDGMENTS
None.
AUTHOR CONTRIBUTIONS
Conceptualization: all authors. Visualization: AM, AP. Writing–original draft: AM. Writing–review & editing: AP, RD, MJ, NK.
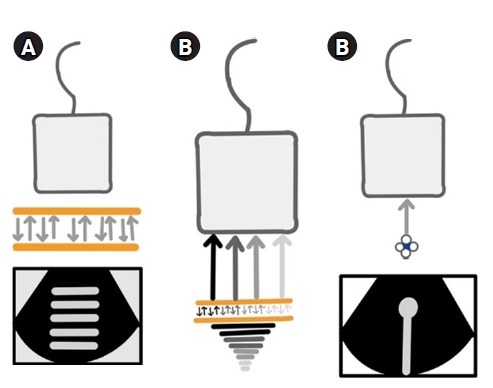
Figure 1.
(A) Reverberation artifacts [2]. When two reflective parallel interfaces lie in the path of the ultrasound beam, the beam gets reflected multiple times between these interfaces. Hence, the transducer assumes them to arise at increasing depths depending on the time delay between transmitted pulse and received echo. This generates an image comprising of multiple echogenic parallel lines placed equidistant from each other, which decrease in brightness with increasing depth. In the chest, the pleural line lies parallel to the probe and acts as a reflective interface when the lungs are aerated, giving rise to reverberation artifacts known as “A-lines” due to repetitive reflections between it and the transducer. Hence, the presence of A-lines denotes an aerated lung. It is important to note that tissue harmonic imaging (THI) will decrease this artifact. (B) Comet-tail artifacts [3]. These are a subtype of reverberation artifacts arising from highly reflective, closely apposed interfaces like calcium, cholesterol crystals, and metal, which cannot be resolved separately. The comet-tail artifact appears as a tapering echogenic cone, showing decreased amplitude and width with increasing depths. Previously, the B-lines were called comet-tail artifacts. (C) Ring-down artifacts [2]. These are similar to comet-tail artifacts but arise from fluid trapped between air. B-lines have been described to be ring-down artifacts. Comet-tail and ring-down artifacts are minimized by spatial compound imaging, which needs to be turned off to get less divergent, sharper, and brighter B-lines. THI also assists in producing sharper comet tails. Permission obtained from RSNA to reproduce images in print or web.
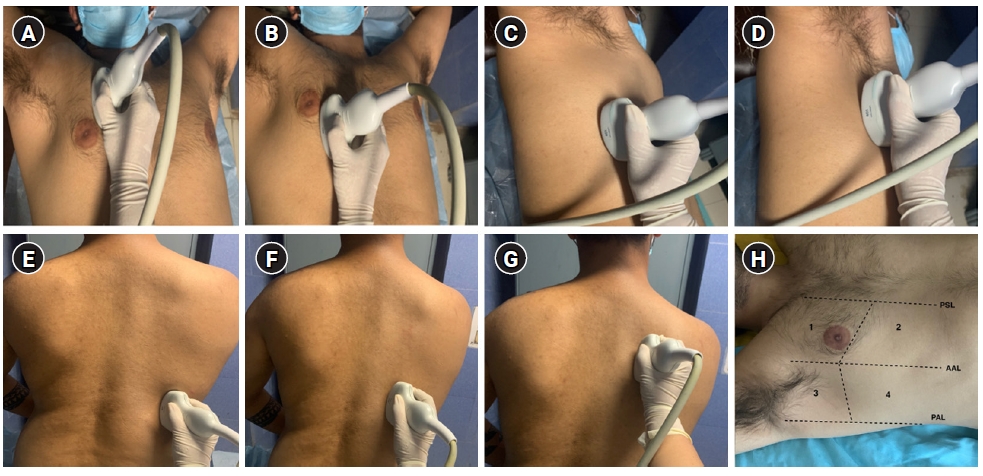
Figure 2.
Focused transthoracic ultrasound using 14-zone scanning protocol by Laursen et al. [6], based on principles of Lichtenstein and Volpicelli, using a curved array low-frequency transducer placed in a longitudinal axis over an intercostal space with the patient in a supine position. (A) Zone R1: transducer placed in the 2nd intercostal space, a few centimeters away from the sternum. (B) Zone R2: transducer placed in the 4th intercostal space in the mid-clavicular line. (C) Zone R3: transducer placed in the mid-axillary line on the lower part of the lateral chest, in approximately the 5th or 6th intercostal space. (D) Zone R4: transducer placed in the mid-axillary line on the upper part of the lateral chest, in the 3rd intercostal space. (E) Zone R5: with the patient in a sitting position, the posterior chest wall is scanned by placing the transducer on the lower part of the chest along a vertical line passing through the inferior angle of the scapula. (F) Zone R6: the transducer is placed medially in the posterior midclavicular line at a level corresponding to middle to lower part of the scapula. (G) Zone R7: transducer placed further cranially, medial to the upper part of the scapula. Similarly, scanning is done on the left side in zones L5–L7. (H) Zone 8 scanning of anterolateral chest wall proposed by Volpicelli et al. Zones are divided into anterior and lateral by the parasternal line (PSL), anterior axillary line (AAL), posterior axillary line (PAL), and upper and basal by a line passing below/at the level of the nipple-areola complex. Zone 1: anterior upper; zone 2: anterior basal; zone 3: lateral upper; zone 4: lateral basal.
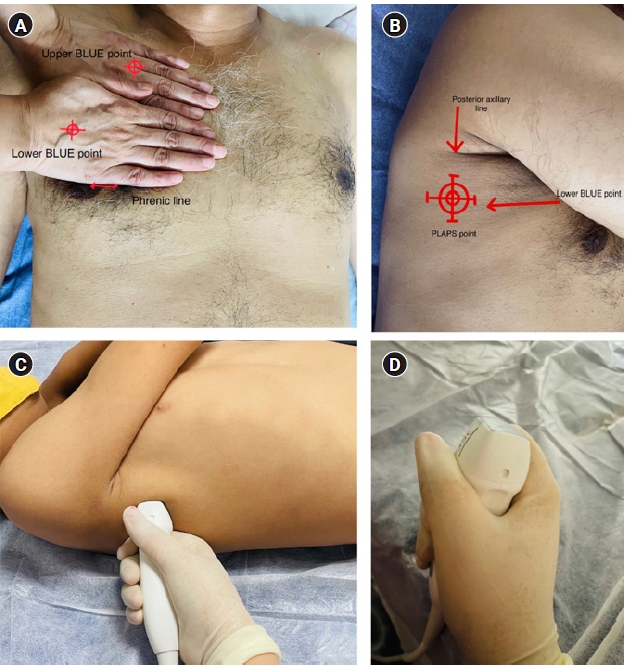
Figure 3.
Localizing the bedside lung ultrasound in emeregency (BLUE) points [7]. (A) The radiologist first compares their hands with the patient's and places one hand just below the clavicle with fingertips at the midline. The “upper BLUE point” is located at the root of the middle and ring fingers. The other hand is applied just below the upper one, excluding the thumb. The “lower BLUE point” is located in the middle of the palm of the lower hand with the inferior edge of the little finger indicating the “phrenic line.” (B) The “posterolateral alveolar and/or pleural syndrome (PLAPS) point” which lies at the intersection of the posterior continuation of lower BLUE point and posterior axillary line, is used to scan the posterior lung zones in a critically ill patient in supine/semi-recumbent position. It is best performed with a small footprint probe (C, D) which is held like a tennis racket, placed perpendicular to the PLAPS point, and directed as cranially as possible for a wider scanning window.
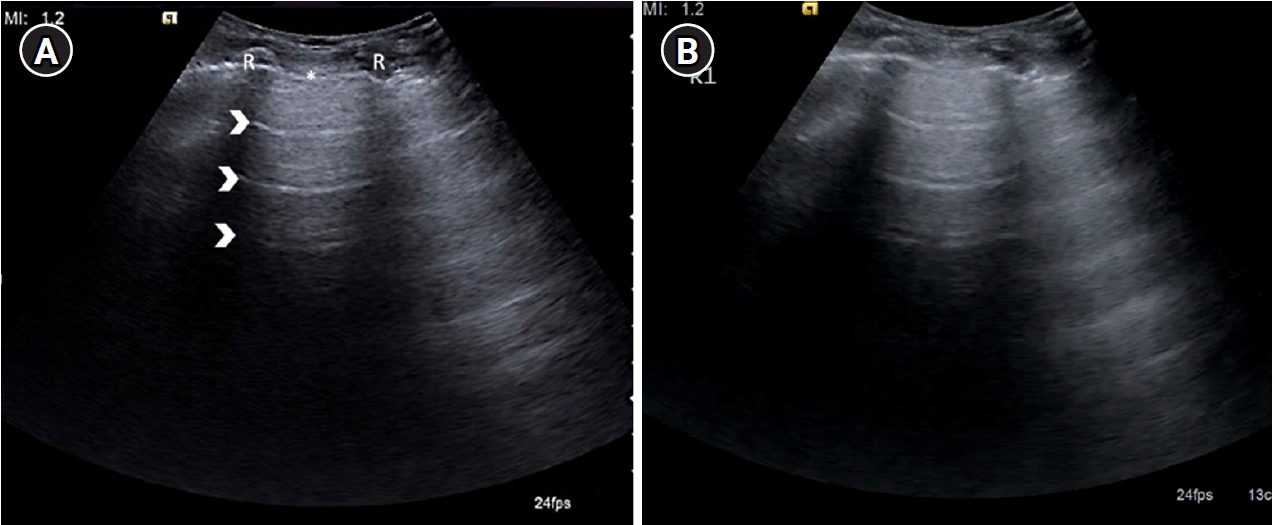
Figure 4.
(A) Longitudinal ultrasound scan of the second intercostal space in the mid-clavicular line on anterior chest wall depicting sonographic appearance of normal lung, identified by the landmarks forming the “bat sign”: two ribs (R) with posterior acoustic shadowing representing the wings of the bat, and the hyperechoic pleural line (asterisk), its body. A-lines (arrowheads) can be seen parallel to the pleural line. (B) Cine US clip depicting the same (Supplementary Material 1).
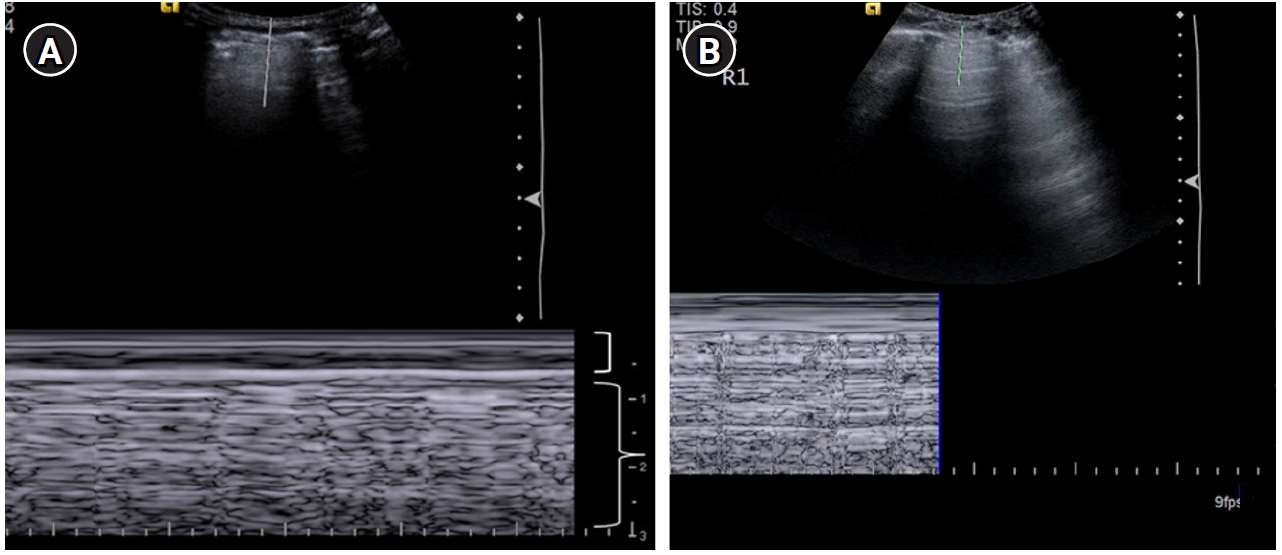
Figure 5.
Lung sliding. (A) M-mode with the cursor over the pleural line illustrating the “seashore sign.” The motionless portion of the chest above the pleural line creates horizontal “waves,” (bracket) and the lung sliding below the pleural line creates a granular pattern, the “sand” (brace). (B) Cine US clip demonstrating the same (Supplementary Material 2).
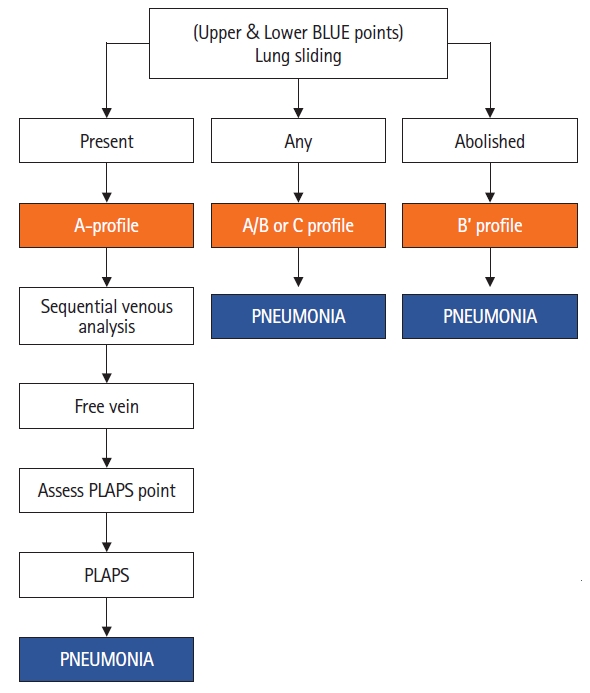
Figure 6.
The presence of lung sliding and A-lines constitutes the A-profile [7]. This is followed by sequential venous analysis to look for thrombosed veins (pulmonary embolism) or assessment of posterolateral alveolar and/or pleural syndrome (PLAPS) point in case of free veins to diagnose pneumonia (PLAPS) and chronic obstructive pulmonary disease (COPD)/asthma (no PLAPS). BLUE: bedside lung ultrasound in Emergency.
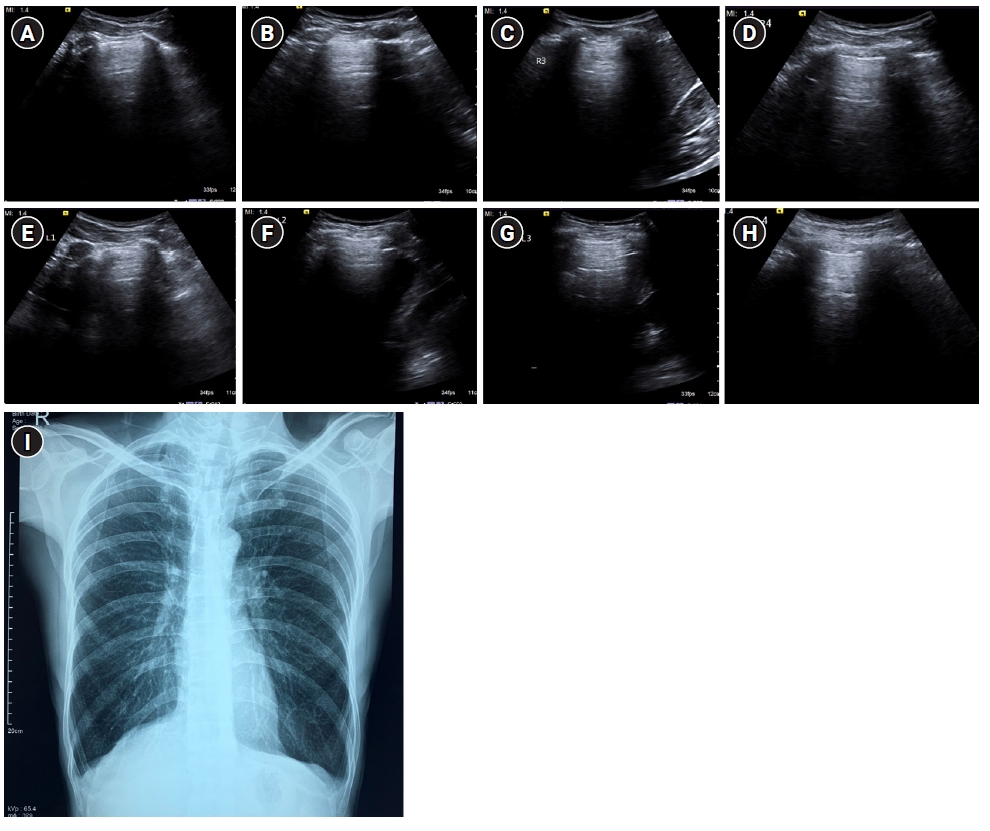
Figure 7.
A profile. Sagittal greyscale ultrasound scans (A-H) of eight lung zones in bilateral anterolateral chest wall revealing the A-profile A-lines with lung sliding and absence of B-lines in a 30-year-old afebrile male with a history of chronic cigarette smoking, presenting with dyspnea, diagnosed as exacerbation of chronic obstructive pulmonary disease/asthma on ultrasound. (I) Findings on chest X-ray were seen to be concordant. Bilateral lung fields appear hyperinflated with rounded costophrenic angles and flattening of hemidiaphragm.
Figure 8.
(A) Longitudinal scan of anterior chest wall showing 3 “B-lines”: comet-tail artifacts, always arising from the pleural line, and always moving in synchrony with lung-sliding. They are almost always long, well-defined, laser-like, hyperechoic, erasing A-lines, and are considered significant when ≥3. Few B-lines may be normally seen in basal lung zones. (B) Cine US clip demonstrating the same (Supplementary Material 3).
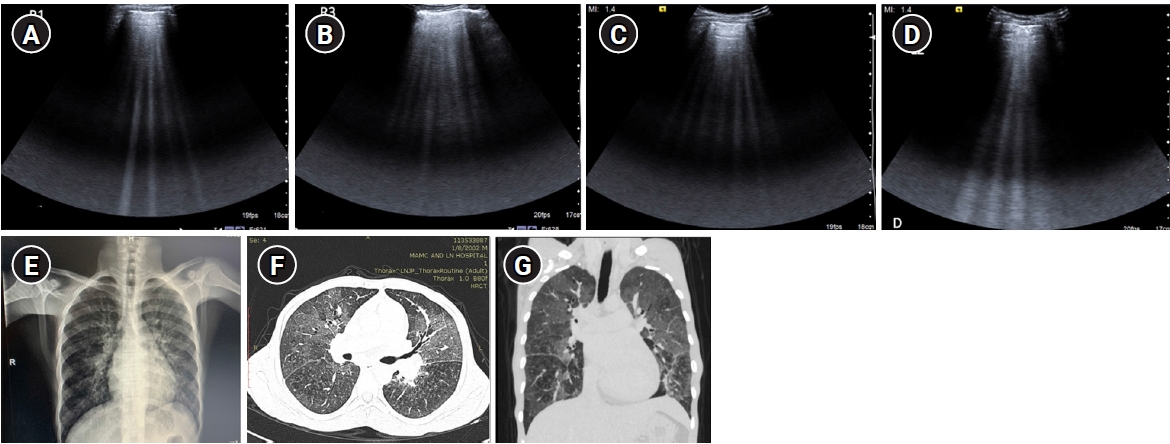
Figure 9.
B-profile. Diffuse interstitial syndrome on ultrasound, diagnosed by the presence of multiple (≥3) B-lines in >1 scanning zone in anterolateral chest wall on each side in a patient presenting with acute dyspnea and hemoptysis. (A, B) Four B-lines are known as “septal rocket” pattern and represent interlobular septal thickening. (C, D) Five or more B-lines are called “ground glass rocket” patterns, representing ground-glass areas on the computed tomography of the chest. the pleural line in this case was regular in appearance. The patient was diagnosed with pulmonary edema based on ultrasound findings. (E) Chest X-ray revealed concordant findings in the form of cephalization of the pulmonary vasculature and prominent interstitial markings. Axial (F) and coronal (G) sections from contrast-enhanced chest computed tomography scan performed in the patient revealed ground glass opacities and Interlobular septal thickening as demonstrated by the “ground glass rocket” pattern and “septal rocket” pattern respectively on ultrasound, providing further confirmation of the diagnosis.
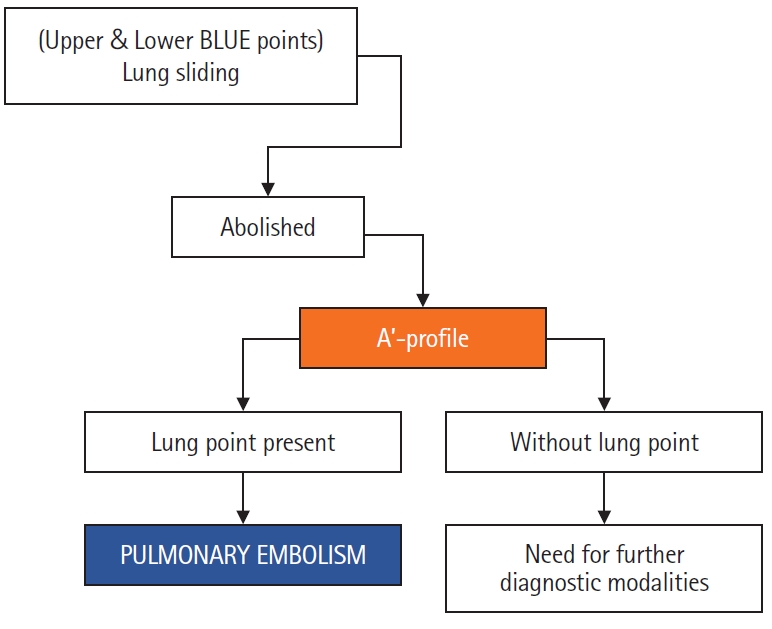
Figure 10.
An abolished lung sliding combined with “A-line sign” (exclusive A-lines with absence of B-lines) is assigned the A’ profile [7]. Detection of “lung point” confirms the diagnosis as pneumothorax. If Lung point is not demonstrated, the patient would require further diagnostic modalities for assessment. BLUE: bedside lung ultrasound in Emergency.
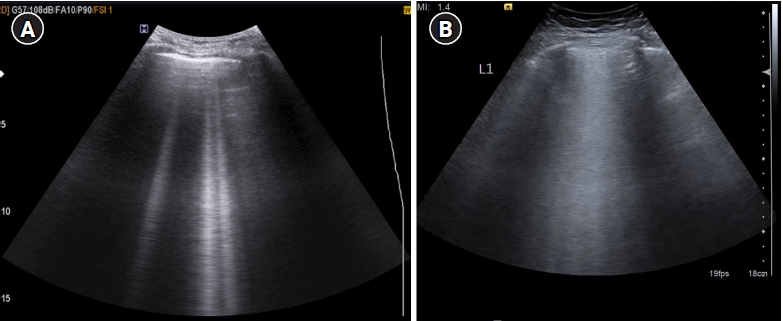
Figure 11.
(A-E) A’ profile. Sagittal grey scale ultrasound scan (A) with M-mode tracing (B) in a 6-year old boy with history of dyspnea, chest pain and previous intercostal chest tube drainage for empyema revealed abolished lung sliding in the form of “stratosphere sign”: horizontal lines above and below the pleural line, in the left anterior and lateral lung zones with presence of A-lines and absent B-lines (known as A’ profile). (C) Diagnosis of pneumothorax was confirmed on ultrasound by localizing the “lung point”: visualizing intermittent stratosphere sign and seashore sign (arrows). The lung point was however visualized in posterolateral lung zones, indicating a large pneumothorax. (D) Chest X-ray in the same patient revealed a large left sided pneumothorax with contralateral tracheomediastinal shift, further confirming the findings of a large pneumothorax as diagnosed on ultrasound. The patient was however hemodynamically stable. (E) Contrast-enhanced chest computed tomography scan chest revealed a bronchopleural fistula (arrow). (F) Cine US clip showing absent lung sliding (Supplementary Material 4). (G) Cine US clip showing “stratosphere sign (Supplementary Material 5).”
Figure 12.
Anterior consolidation is called the C profile [7]. Unilateral B-lines (atleast 3 in one scanning zone) with A lines on the contralateral side is called the A/B profile. An abolished lung sliding combined with B lines is called B’ profile. Meanwhile, A-profile anteriorly with presence of posterolateral consolidation is called the A-no V-PLAPS profile. BLUE: bedside lung ultrasound in Emergency; PLAPS: posterolateral alveolar and/or pleural syndrome.
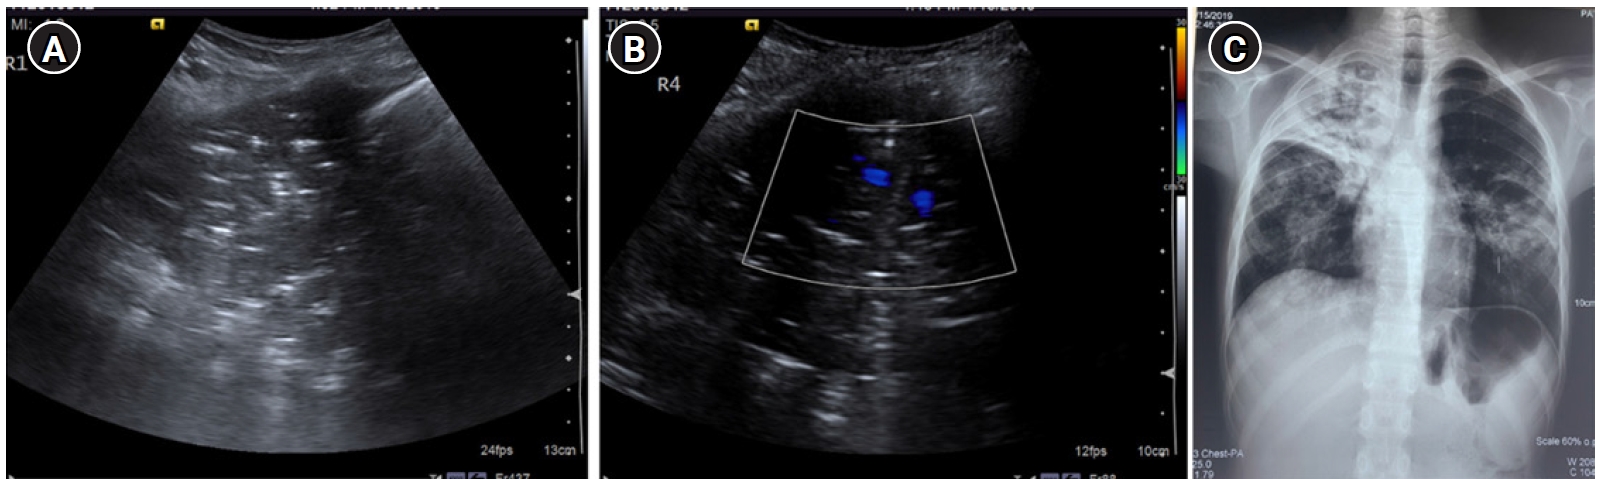
Figure 13.
C profile. (A) Greyscale sagittal ultrasound scan of the right upper anterolateral chest in a 13-year-old female presenting with dyspnea, fever, and cough demonstrating “translobar consolidation” identified by “tissue-like” echotexture, absence of A-lines, presence of sonographic air-bronchograms and a lack of a shredded border. (B) Colour doppler revealed the presence of internal vascularity. (C) Right upper lobe consolidation with air bronchograms was similarly noted on Chest X-ray, correlating with the ultrasound findings.
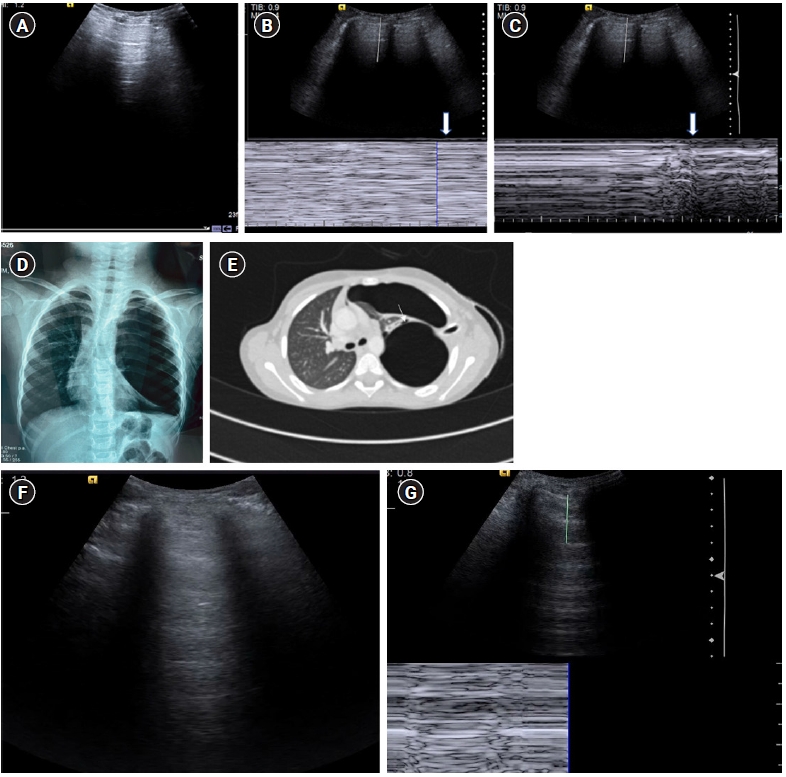
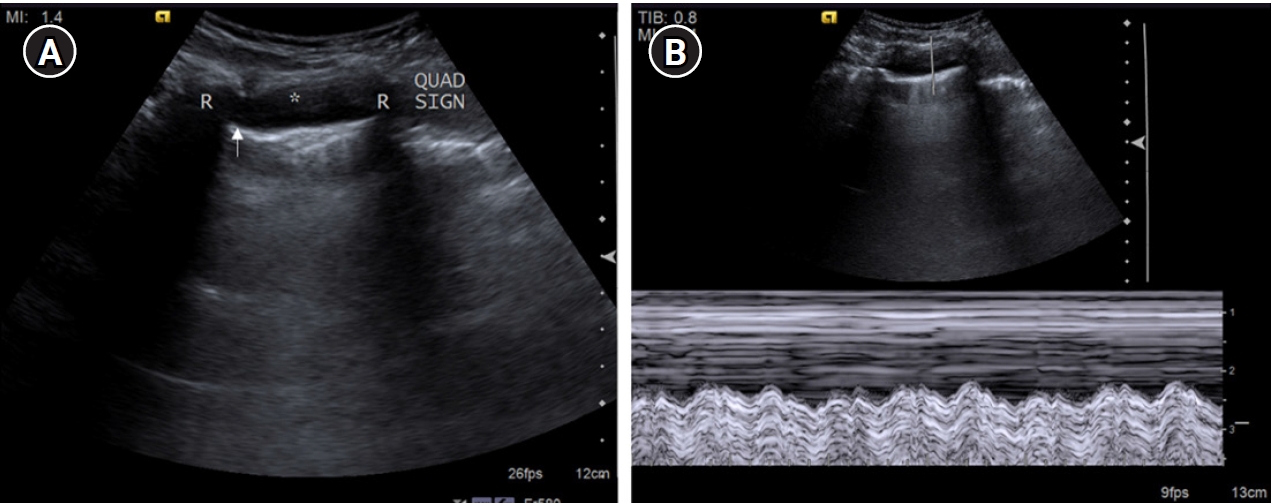
Figure 14.
posterolateral alveolar and/or pleural syndrome profile. (A) Pleural effusion (asterisk) in a 20-year-old female presenting with breathlessness and chest pain identified by visualizing the underlying visceral pleural line/“lung line” (arrow). “Quad sign,” a sonographic feature is depicted in the form of a rough quadrilateral bounded by the two ribs (R) with their posterior acoustic shadow on either side, the pleural line superiorly, and the lung line inferiorly. (B) M-mode tracing in a pleural effusion reveals a “sinusoidal” pattern. The underlying lung appears to be normal, with few Sub-B lines seen.
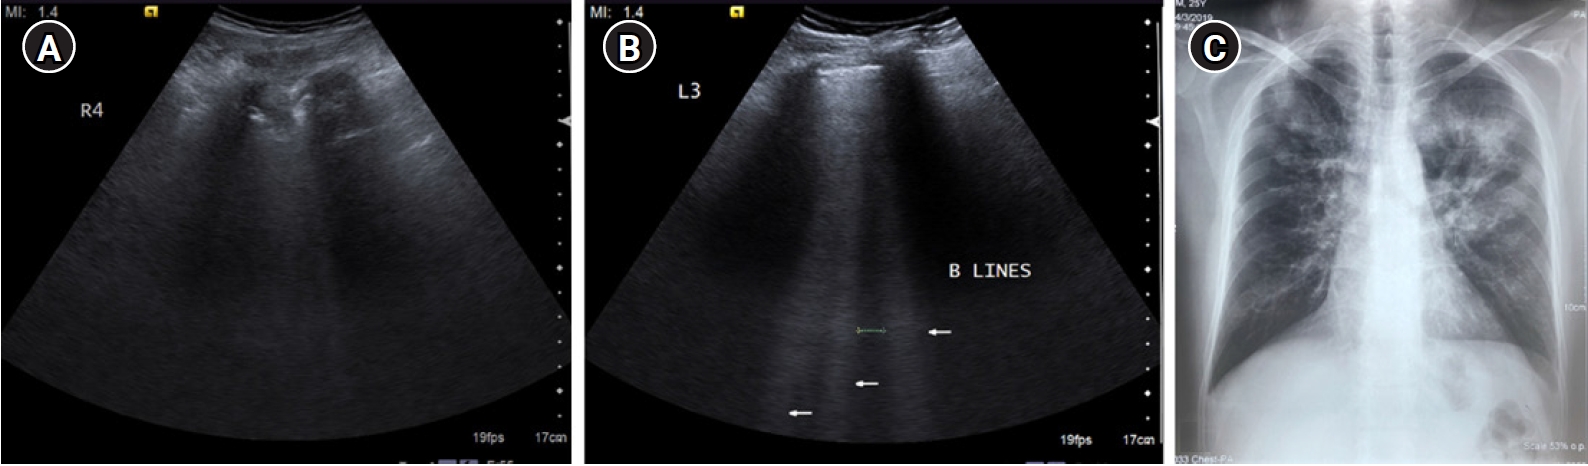
Figure 15.
(A) Greyscale sagittal ultrasound scan of the right upper lateral chest in a 25-year-old male presenting with dyspnea, fever, and cough demonstrating “non-translobar consolidation”/“fractal sign” identified by “tissue-like” echotexture, absence of A-lines with an underlying shredded border. (B) Three B-lines representing the “lung rocket” pattern were noted only on the left side. Unilateral lung rockets are seen in pneumonia. (C) Chest X-ray revealed fluffy air space opacities in bilateral lung fields (left>right). The patient was diagnosed with pneumonia.
References
1. Lichtenstein DA. BLUE protocol and FALLS-protocol: two applications of lung ultrasound in the critically ill. Chest 2015;147:1659-70.ArticlePubMed
3. Baad M, Lu ZF, Reiser I, Paushter D. Clinical significance of US artifacts. Radiographics 2017;37:1408-23.ArticlePubMed
4. Gargani L, Volpicelli G. How I do it: lung ultrasound. Cardiovasc Ultrasound 2014;12:25. ArticlePubMedPMCPDF
5. Jambrik Z, Monti S, Coppola V, Agricola E, Mottola G, Miniati M, et al. Usefulness of ultrasound lung comets as a nonradiologic sign of extravascular lung water. Am J Cardiol 2004;93:1265-70.ArticlePubMed
6. Laursen CB, Rahman NM, Volpicelli G. Thoracic ultrasound. Lausanne, European Respiratory Society. 2018.
7. Lichtenstein D. Lung ultrasound in the critically ill: The BLUE protocol. Switzerland, Springer. 2016.ArticlePubMed
8. Lichtenstein DA, Menu Y. A bedside ultrasound sign ruling out pneumothorax in the critically ill: lung sliding. Chest 1995;108:1345-8.ArticlePubMed
9. Zanobetti M, Scorpiniti M, Gigli C, Nazerian P, Vanni S, Innocenti F, et al. Point-of-care ultrasonography for evaluation of acute dyspnea in the ED. Chest 2017;151:1295-301.
10. Volpicelli G, Mussa A, Garofalo G, Cardinale L, Casoli G, Perotto F, et al. Bedside lung ultrasound in the assessment of alveolar-interstitial syndrome. Am J Emerg Med 2006;24:689-96.ArticlePubMed
11. Reissig A, Kroegel C. Transthoracic sonography of diffuse parenchymal lung disease: the role of comet tail artifacts. J Ultrasound Med 2003;22:173-80.ArticlePubMed
12. Gargani L, Doveri M, D'Errico L, Frassi F, Bazzichi ML, Delle Sedie A, et al. Ultrasound lung comets in systemic sclerosis: a chest sonography hallmark of pulmonary interstitial fibrosis. Rheumatology (Oxford) 2009;48:1382-7.ArticlePubMed
13. Copetti R, Copetti P, Soldati G. Ultrasound pattern in pulmonary fibrosis: have the vertical artifacts disappeared? Ultrasound Med Biol 2010;36:356-7.ArticlePubMed
14. Reissig A, Copetti R. Lung ultrasound in community-acquired pneumonia and in interstitial lung diseases. Respiration 2014;87:179-89.ArticlePubMedPDF
15. Buda N, Piskunowicz M, Porzezińska M, Kosiak W, Zdrojewski Z. Lung ultrasonography in the evaluation of interstitial lung disease in systemic connective tissue diseases: criteria and severity of pulmonary fibrosis: analysis of 52 patients. Ultraschall Med 2016;37:379-85.ArticlePubMed
16. Gargani L. Lung ultrasound: a new tool for the cardiologist. Cardiovasc Ultrasound 2011;9:6. ArticlePubMedPMCPDF
17. Lichtenstein D. Whole body ultrasonography in the critically ill. Heidelberg, Berlin, New York, Springer-Verlag. 2010.
18. Brusasco C, Santori G, Bruzzo E, Trò R, Robba C, Tavazzi G, et al. Quantitative lung ultrasonography: a putative new algorithm for automatic detection and quantification of B-lines. Crit Care 2019;23:288. ArticlePubMedPMCPDF
19. Lichtenstein D, Mezière G, Biderman P, Gepner A. The "lung point": an ultrasound sign specific to pneumothorax. Intensive Care Med 2000;26:1434-40.ArticlePubMedPDF
20. De Luca C, Valentino M, Rimondi MR, Branchini M, Baleni MC, Barozzi L. Use of chest sonography in acute-care radiology. J Ultrasound 2008;11:125-34.ArticlePubMedPMC
21. Murphy M, Nagdev A, Sisson C. Lack of lung sliding on ultrasound does not always indicate a pneumothorax. Resuscitation 2008;77:270. Article
22. Ball CG, Kirkpatrick AW, Feliciano DV. The occult pneumothorax: what have we learned? Can J Surg 2009;52:E173-9.PubMedPMC

 , Anjali Prakash1, Rashmi Dixit1, Monica Juneja2


 PubReader
 ePub Link
 Cite
Cite