Abstract
-
Background
- There is a lack of data on extravascular lung water index (EVLWi), pulmonary vascular permeability index (PVPi), and global end-diastolic volume index (GEDVi) during prone position ventilation (PPV) in coronavirus disease 2019 (COVID-19) patients. The objectives of this study were to analyze trends in EVLWi, PVPi, and GEDVi during PPV and the relationships between these parameters and PaO2/FiO2.
-
Methods
- In this preliminary retrospective observational study, we performed transpulmonary thermodilution (TPTD) in seven mechanically ventilated COVID-19 patients without cardiac and pulmonary comorbidities requiring PPV for 18 hours, at specific times (30 minutes pre-PPV, 18 hours after PPV, and 3 hours after supination). EVLWi, PVPi and GEDVi were measured. The relationships between PaO2/FiO2 and EVLWi, and PVPi and GEDVi values, in the supine position were analyzed by linear regression. Correlation and determination coefficients were calculated.
-
Results
- EVLWi was significantly different between three time points (analysis of variance, P=0.004). After 18 hours in PPV, EVLWi was lower compared with values before PPV (12.7±0.9 ml/kg vs. 15.3±1.5 ml/kg, P=0.002). Linear regression showed that only EVLWi was correlated with PaO2/FiO2 (β =–5.757; 95% confidence interval, –10.835 to –0.679; r=–0.58; R2=0.34; F-test P=0.029).
-
Conclusions
- EVLWi was significantly reduced after 18 hours in PPV and values measured in supine positions were correlated with PaO2/FiO2. This relationship can help clinicians discriminate whether deterioration in gas exchange is related to fluid overload or disease progression. Further clinical research should evaluate the role of TPTD parameters as markers to stratify disease severity and guide clinical management.
-
Keywords: acute respiratory distress syndrome; COVID-19; prone position; thermodilution
INTRODUCTION
Among patients hospitalized for coronavirus disease 2019 (COVID-19), from 5 to 20% meet Berlin’s acute respiratory distress syndrome (ARDS) definition criteria with hypoxemia and bilateral infiltrates on chest X-ray [1-3]. Atelectasis, consolidation, impaired pulmonary blood flow, pulmonary vascular obstruction, and shunting/increased ventilation-perfusion mismatch result in hypoxemia and/or impaired decarboxylation [4]. Prone position ventilation (PPV) and appropriate fluid management represent the cornerstones for the treatment of patients with COVID-19-associated ARDS (CARDS) [5,6] and have been widely adopted as standard clinical practice for patients with severe CARDS [7].
PPV reduces mortality in patients with ARDS and is recommended in patients with moderate to severe CARDS [6]. However, fluid overload, causing pulmonary edema, can reduce the positive effects of PPV on gas exchange, leading clinicians to consider the patient to be poorly responsive to PPV [8]. Fluid restriction in patients with ARDS results in improved pulmonary function and fewer ventilator days [9,10]. In contrast, uncontrolled and inadequate fluid administration are associated with poor outcomes [5].
In patients requiring multiple cycles of PPV, the quantification of pulmonary edema related to fluid overload can help clinicians understand whether deterioration in gas exchange is related to inappropriate fluid management or represents the evolution of disease severity. Hemodynamic monitoring based on transpulmonary thermodilution (TPTD) provides useful indexes to help clinical management in CARDS patients. In detail, TPTD allows clinicians to calculate the (1) extravascular lung water index (EVLWi), which is the volume contained in the interstitium and alveoli [11], and (2) the pulmonary vascular permeability index (PVPi), a marker of lung vascular injury [12,13]. At the same time, TPTD allows clinicians to estimate volumetric preload index, the global end-diastolic volume index (GEDVi) that represents the volume of blood in cardiac chambers at the end of the diastolic phase.
There is a lack of data in the literature about trends in EVLWi, PVPi and GEDVi during PPV in patients with CARDS. The primary purpose of the present preliminary retrospective study was to analyze the effects of PPV on EVLWi, PVPi and GEDVi trends. The secondary purpose was to study the relationships between these parameters and PaO2/FiO2 in the supine position.
MATERIALS AND METHODS
The local Ethics Committee of University of Naples Luigi Vanvitelli approved this analysis (No. AOC-0016235-2020) and waived the need for informed consent due to the observational nature of the study.
Study Design and Patients
We followed the Strengthening the Reporting of Observational Studies in Epidemiology (STROBE) recommendations. The present study was a preliminary retrospective observational study based on seven patients, without severe cardiac and pulmonary comorbidities, with confirmed Severe acute respiratory syndrome coronavirus 2 (SARS-CoV-2) infection (positive reverse-transcriptase polymerase chain reaction testing on nasopharyngeal swab) requiring mechanical ventilation in intensive care unit (ICU) for CARDS, from May to September 2021.
On admission, all patients underwent arterial blood gas (ABG) analysis and blood chemistry tests, cell-blood count, coagulation (activated partial thromboplastin time, prothrombin time, international normalized ratio, D-dimer, fibrinogen), liver (aspartate transaminase, alanine aminotransferase, bilirubin), kidney (urea, creatinine), heart (troponin I, creatine phosphokinase-MB), and inflammation and infectious (C reactive protein, interleukin 6, ferritin, procalcitonin) marker measurements. Laboratory tests were daily performed or repeated based on clinical changes and therapeutic adjustments. A 12-lead electrocardiogram was performed and reviewed by an intensivist. Furthermore, an experienced and certified intensivist performed transthoracic echocardiography to provide information about right and left ventricular functions on admission and during the length of ICU stay. Chest computed tomography (CT) was performed to report lung disease severity, signs of pulmonary thromboembolism, pneumothorax and pneumomediastinum [14]. Heart rate (HR), invasive blood pressure, SpO2, body temperature, and diuresis were monitored continuously.
Sedation, Ventilation and Therapy Protocol
We used continuous infusion of propofol (2–4 mg/kg/hr) or dexmedetomidine (0.8–1.5 μg/kg/hr) and/or remifentanil (0.1–0.5 μg/kg/min) to sedate patients connected to mechanical ventilators (model SV 600; Mindray, Huntingdon, UK). According to the bispectral index (BIS; Medtronic, Minneapolis, MN, USA) monitoring value, the infusion rates were adjusted stepwise to provide adequate sedation (BIS range, 40%–60%). In case of mismatch to the ventilator, PPV, or high plateau pressures (Pplat), we used deep sedation plus neuromuscular blockade (bolus 0.7 mg/kg iv, followed by continuous infusion of rocuronium, 0.4–0.7 mg/kg/hr). Furthermore, when neuromuscular blockade was required, we adjusted infusions according to the nociception level index (Medasense, Ramat Gan, Israel; target value <25), with BIS or alone (prone ventilation) to obtain an optimal level of analgosedation.
We adopted a protective ventilation strategy [15] using pressure-controlled ventilation. Inspiratory pressure (Pinsp) was set to reach the targeted tidal volume (6 ml/kg of predicted body weight, estimated by Devine formula), keeping Pplat ≤30 cm H2O and positive end-expiratory pressure (PEEP) values titrated to maintain low driving pressures (estimated as the difference between Pplat and PEEP, target value <15 cm H2O). We calculated static respiratory system compliance (Crs) as the tidal volume and driving pressure ratio.
In patients with PaO2/FiO2 <100 mm Hg, and in the absence of contraindications (i.e., hemodynamic instability), we performed PPV for 18 hours continuously and repeated PPV in case of necessity. Pronation maneuvers were performed applying face, chest, and leg protective systems (cap for the head: Nizell Medical, Schwyz; Z-Flo Fluidized Positioners Molnlycke for chest and legs).
We adopted a conservative fluid strategy to reach daily negative/near-zero fluid balance, avoiding increase in “lung water.” However, slight positive fluid balance may be allowed to protect renal function. Drugs such as inotropes, vasoconstrictors, and vasodilators were used only when fluids alone were not sufficient to optimize hemodynamics. For specific SARS-CoV-2 infection treatment, our protocol provided the administration of antiviral drugs (remdesivir: first dose 200 mg, then 100 mg, iv, once a day for 5 days), immunoglobulins (Pentaglobin: 5 ml/kg for 12 hours, iv, once a day for 3 days) and glucocorticoids (methylprednisolone: 0.5 mg/kg, iv, twice a day). Due to the high risk of thromboembolic events, all patients received low weight molecular heparin (enoxaparin), subcutaneous, following this protocol. Patient’s weight <60 kg: 4,000 IU, twice a day; 60–80 kg: 6,000 IU, twice a day; >80 kg: 8,000 IU, twice a day. In addition, antiplatelet agents were administered.
TPTD Timing and Variables of Interest
We monitored all patients using the hemodynamic platform EV 1000 (Edwards Lifesciences, Irvine, CA, USA) with the VolumeView system. This monitor computes all parameters derived by the TPTD and arterial pressure waveform analysis. To perform TPTD, we injected a cold saline bolus (20 ml) by a central venous catheter placed in the internal jugular vein. With time, the blood temperature changed and was registered on the arterial side by a thermistor tipped arterial catheter (5 Fr) placed in the femoral artery [16]. TPTD was performed in triplicate according to the manufacturer’s recommendations, discarding measurements where cardiac output differed more than 10% from the two other measurements. The mean values of each variable were used for analysis.
Adjusted body surface area volumetric parameters were the cardiac index, the stroke volume index (SVI), GEDVi, the intrathoracic blood volume index (ITBVi, representing the whole blood volume in the chest), and EVLWi. TPTD was performed under stable hemodynamic conditions and the following measurements were taken: (1) hemodynamic parameters: HR, mean systemic arterial pressure, central venous pressure (CVP), cardiac index and SVI; (2) volumetric preload index: ITBVi and GEDVi; and (3) lung water volumetric index: EVLWi and PVPi. At the same time, ABG was performed and pH, PaO2, PaCO2, lactate concentration, and PaO2/FiO2 were noted. Moreover, clinicians noted ventilation settings at the time of TPTD and reported Pinsp, PEEP, respiratory rate, driving pressure, Crs, and FiO2.
Study Objectives and Statistical Analysis
The primary objective was to analyze how PPV modified parameters obtained by TPTD at specific times: (1) pre-pronation: 30 minutes before pronation; (2) pronation: 18 hours after pronation; and (3) post-pronation: 3 hours after supination. The secondary objective was to analyze the relationships between EWLVi, PVPi, and GEDVi, and PaO2/FiO2 in the supine position. Age, sex, weight, height, body mass index, comorbidities, laboratory, and blood gas analysis data were noted on admission.
We used Microsoft Excel 2016 (Microsoft Corp., Redmond, WA, USA) and MedCalc Statistical Software version 19.6 (MedCalc Software, Ostend, Belgium; https://www.medcalc.org; 2020) for analyses. Categorical variables and frequencies are reported as absolute numbers and percentages (%). Continuous variables were tested for normal distributions with the Shapiro-Wilk test. Normally distributed data are presented as mean±standard deviation. In contrary cases, we reported data as median and first and third quartile (q1–q3).
To analyze the effects of PPV on parameters obtained by TPTD, we performed analysis of variance (ANOVA) for repeated measures or the Friedman test according to data distribution. For ANOVA, to verify the equality of variances of the differences between measurements, sphericity (ε) was estimated by the Greenhouse-Geisser method. When the estimated ε>0.75, then the Huynh-Feldt correction was used, while in contrary cases, the more conservative Greenhouse-Geisser correction was preferred. We performed post hoc analysis to compare inter-group differences with Bonferroni correction for ANOVA or Conover for Friedman.
We performed a single variable linear regression analysis to analyze the relationships between PaO2/FiO2 (dependent variable) and EVLWi, PVPi, and GEDVi (independent variables). To avoid bias related to patient position, we considered only TPTD values noted in the supine position. Intercepts, beta coefficients (β), 95% confidence intervals (CIs), Pearson correlations (r), and determination coefficients (R2) were computed. The F-test was performed to test for the presence of a linear relationship between variables and the regression equation was reported for significant results. Residuals were tested for normal distribution with the Shapiro-Wilk test. All tests were performed with an α=0.05 and P-values <0.05 were considered statistically significant.
RESULTS
Our sample consisted of six male patients and one female patient with severe CARDS (mean PaO2/FiO2 on admission 63.1±17.8 mm Hg) requiring endotracheal intubation and ICU admission. Chest CT on admission showed severe CARDS patterns, without signs of pulmonary thromboembolism, pneumothorax, or pneumomediastinum. Table 1 shows the main characteristics of the sample.
Before pronation, transthoracic echocardiography showed no signs of right or left ventricular impairment, and pronation maneuvers were performed without adverse or traumatic events. All patients received neuromuscular blockade during the PPV. No critical events such as hemodynamic instability or sudden desaturation occurred during the observational time. All patients followed our fluid management protocol, keeping a negative/near-zero fluid balance without the development of oligoanuria or increase in creatinine level. No patients required catecholamines infusion.
TPTD was performed at mentioned times for all patients, and Table 2 reports values for all parameters noted. During TPTD, all patients were properly sedated according to our protocol. Regarding TPTD parameters, ANOVA for repeated measurements showed a significant trend only for EVLWi (P=0.004) (Figure 1). After 18 hours in PPV, EVLWi was lower compared with values before proning (12.7±0.9 ml/kg vs. 15.3 ±1.5 ml/kg; mean difference, –2.54±0.15 ml/kg; 95% CI, –3.83 to –1.26 ml/kg; Bonferroni corrected P=0.002). EVLWi increased after 3 hours in supine position, although the change was not statistically significant (13.5±0.6 ml/kg; mean difference, +0.79±0.20 ml/kg; 95% CI, –0.67 to 2.24 ml/kg; Bonferroni corrected P=0.381). No other significant trends were noted for CVP, SVI, cardiac index, GEDVi, or PVPi, except for HR (Friedman P=0.038). Inter-group analysis showed that HR was higher only 3 hours after supine positioning (corrected P<0.05).
PaO2/FiO2 showed increased values after 18 hours in PPV, passing from 64.8±11.8 mm Hg before pronation to 142.6±76.1 mm Hg, and decreased to 77.8±15.9 mm Hg at three hours after supination. ANOVA showed a statistically significant p-value (0.038), but the inter-group analysis did not. No other differences in the ABG analysis or ventilatory parameters, such as Crs, were noted.
A sample of 14 measurements was used for linear regression analysis (Table 3). EVLWi, PVPi, and GEDVi showed negative correlations with PaO2/FiO2 (r=–0.58, r=–0.19 and r=–0.37, respectively), but only EVLWi predicted PaO2/FiO2 value (β=–5.757; 95% CI, –10.835 to –0.679; R2=0.34; F-test P=0.029). Residual analysis of the model showed a normal distribution. Figure 2 shows scatter and residual distribution plots for EVLWi.
DISCUSSION
In non-COVID-19 ARDS, PPV improves ventilation/perfusion by opening pulmonary-dependent lung areas and causing homogeneity in the lung tissue [17]. The same mechanisms seem responsible for oxygenation response in CARDS patients during PPV [18]. However, the lack of improvement in gas exchange during PPV can be related to increases in pulmonary edema. Pulmonary edema, whether cardiogenic or noncardiogenic, is characterized by excessive accumulation in EVLWi, while increase in PVPi is the hallmark of ARDS. EVLWi greater than 10 ml/kg is a reasonable criterion for pulmonary edema, and EVLWi greater than 15 mL kg–1 for a high degree of severity. In addition to EVLWi greater than 10 ml/kg, PVPi greater than 3 suggests increased vascular permeability (i.e., ARDS), and PVPi less than 2 represents normal vascular permeability (i.e., cardiogenic pulmonary edema) [19].
In our analysis, EVLWi decreased at 18 hours in PPV, while PVPi and GEDVi showed stable values. PaO2/FiO2 trends showed significant variation during observational time with rapid worsening 3 hours after supine positioning. However, our small sample size limited our ability to detect substantial differences between time points.
Previous studies [20-22] demonstrated that EVLWi and PVPi values were higher in patients with CARDS when compared with “classical” ARDS. EVLWi values in CARDS patients were significantly higher than in non-COVID-19 ARDS patients and high EVLWi values were associated with increased mortality [20]. Shi et al. [21] found that compared with patients without COVID-19, patients with COVID-19 had significantly higher EVLWi and PVPi at baseline, suggesting higher severity of the disease in terms of gas exchange alteration, prone positioning, and ECMO use.
Our data about the EVLWi trends during PPV were in line with those of McAuley et al. [23]. Their prospective observational study on ARDS patients showed a significant decrease in EVLWi values after 18 hours in PPV. Because we did not find significant changes in PVPi values during PPV, reduction in EVLWi seemed to be related to intrapulmonary fluid redistribution/reabsorption rather than real improvement in the severity of disease. Consequently, PPV can be considered “symptomatic treatment” to improve the PaO2/FiO2 ratio, allowing “gentle” lung ventilation and reducing mechanical ventilation-related lung injury. Moreover, PPV can allow clinicians to “gain time” to reduce intense lung inflammatory response. However, data are lacking to explain the pathophysiological mechanisms underlying these potential changes, and the associations between PPV, EVLWi values, and clinical outcomes are still poorly investigated.
In our analysis, GEDVi values did not show statistically significant variations. These data were in contrast with those of Ruste et al. [24]. In their retrospective observational study of ARDS patients undergoing PPV for at least 16 hours, they found a slight yet sustained increase in GEDVi, reversible after return in the supine position, unrelated to fluid administration. It has been speculated that this slight increase in GEDVi might be related to an increase in pulmonary thermal volume in PPV. However, in that previous study, most PPV sessions with significant increases in GEDVi were associated with increases in cardiac index. Since the beginning of the pandemic, evidence suggested an initial conservative approach to fluid resuscitation in patients with COVID-19 [5]. However, it should be considered that hypovolemia and dehydration are frequent causes of acute kidney injury among COVID-19 patients with a worse prognosis [25]. Fluid status prediction is particularly challenging in these patients [26], and further studies are needed to clarify GEDVi modifications during PPV sessions and its value as preload index.
We found a statistically significant negative linear relationship between EVLWi and PaO2/FiO2 values noted in the supine position. In our sample, changes in EVLWi values could explain about 34% of the variation in PaO2/FiO2. Previous studies about the topic were performed on classical ARDS. Kushimoto et al. [27] found a negative and moderate correlation between EVLWi and PaO2/FiO2 (r=–0.355, P<0.0001), while Bhattacharjee et al. [28] found a stronger negative correlation (r=–0.71, P<0.0001).
Our study has several limitations. First, the small sample size limited our statistical analysis and generalization of results. Second, we limited our observations to one PPV cycle and collected data only until 3 hours after returning to the supine position. We did not study how EVLWi, PVPi, and GEDVi changed after 3 hours in the supine position or during consecutive PPV sessions. Third, we performed only a single linear regression analysis due to the small number of observations. Fourth, because pulmonary circulation thrombosis induced by endothelial injury was common in severe CARDS patients [29], this phenomenon could alter parameters obtained by TPTD [16]. However, we monitored right and left ventricular performances by echocardiography during the observational time, and we did not report any findings of acute right ventricular failure due to pulmonary thromboembolism. However, we want to underline that our study reports trends for EVLWi, PVPi, and GEDVi during PPV in severe CARDS patients for the first time.
In conclusion, our preliminary data suggest that TPTD can provide useful data for the clinical management of severe CARDS patients requiring PPV sessions, especially regarding pulmonary edema. EVLWi showed a statistically significant reduction after 18 hours in PPV and values noted in supine positions were correlated with PaO2/FiO2. This relationship can help clinicians discriminate whether gas exchange worsening is related to fluid overload or progression of disease. Further clinical research should evaluate the role of TPTD parameters as markers to stratify disease severity and guide clinical management.
KEY MESSAGES
▪ During prone position ventilation, extravascular lung water index (EVLWi) values decrease, while pulmonary vascular permeability index and global end-diastolic volume index variations were not statistically significant.
▪ EVLWi values showed a statistically significant relationship with PaO2/FiO2 values in the supine position.
▪ EVLWi evaluation can help clinicians determine whether deterioration of gas exchange is related to fluid overload or worsening disease.
NOTES
-
CONFLICT OF INTEREST
No potential conflict of interest relevant to this article was reported.
-
AUTHOR CONTRIBUTIONS
Conceptualization: RCDR. Data curation: RCDR, MG, GM, MDC. Formal analysis: RCDR, AR. Methodology: RCDR. Project administration: RCDR, AC. Visualization: RCDR. Writing–original draft: RCDR, AR, MG, GM, MDC. Writing–review & editing: RCDR, AR, AC.
Figure 1.Boxplot for extra vascular lung water index (EVLWi). The boxplot for EVLWi noted at 30 minutes before pronation (30-min pre-pronation), 18 hours after pronation (18-hr post-pronation), and at three hours post-supination (3-hr post-supination). EVLWi values decreased from 15.3±1.5 ml/kg (30 min pre-pronation) to 12.7±0.9 ml/kg (18 hr after-pronation), returning to 13.5±0.6 ml/kg (3 hr post-supination). Analysis of variance for repeated measurements showed a statistically significant trend (P=0.004). a) Subgroup analysis revealed that variation between EVLWi values noted at 30 minutes pre-pronation and at 18 hours after-pronation was statistically significant, with a mean difference –2.54±0.15 ml/kg (95% confidence interval, –3.83 to –1.26 ml/kg; Bonferroni corrected P=0.002). No other differences were statistically significant. The outlier appears as the square box to the outside of the box plot.
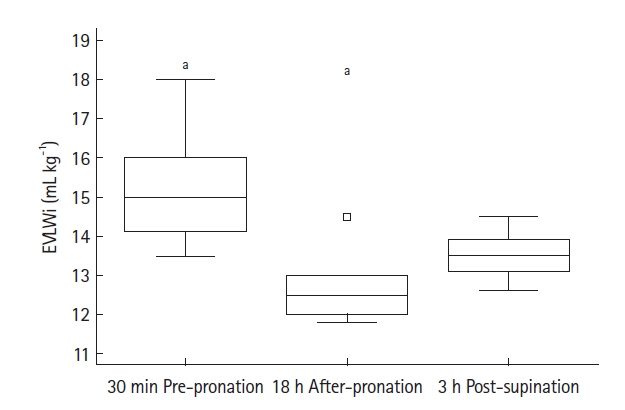
Figure 2.Scatter (A) and residual (B) plots. (A) The scatter plot, with regression line (black line), 95% confidence interval (CI) curves (black dotted curves) and 95% prediction lines (red lines). Linear regression analysis (n=14) showed that extravascular lung water index values noted in the supine position were able to predict PaO2/FiO2. The linear regression equation for the model was: PaO2/FiO2=156.08 (intercept 95% CI, 82.6–229.6; t-statistic=4.626; P<0.001) –5.76 (β 95% CI, –10.83 to –0.68; t-statistic=–2.470; P=0.029) × EVLWi. F-test showed that the linear relationship between EVLWi and PaO2/FiO2 was statistically significant (P=0.029), with R2=0.34. (B) Plot for residual analysis. Shapiro-Wilk test showed that residuals followed a normal distribution (W=0.924, P=0.249). EVLWi: extra vascular lung water index.
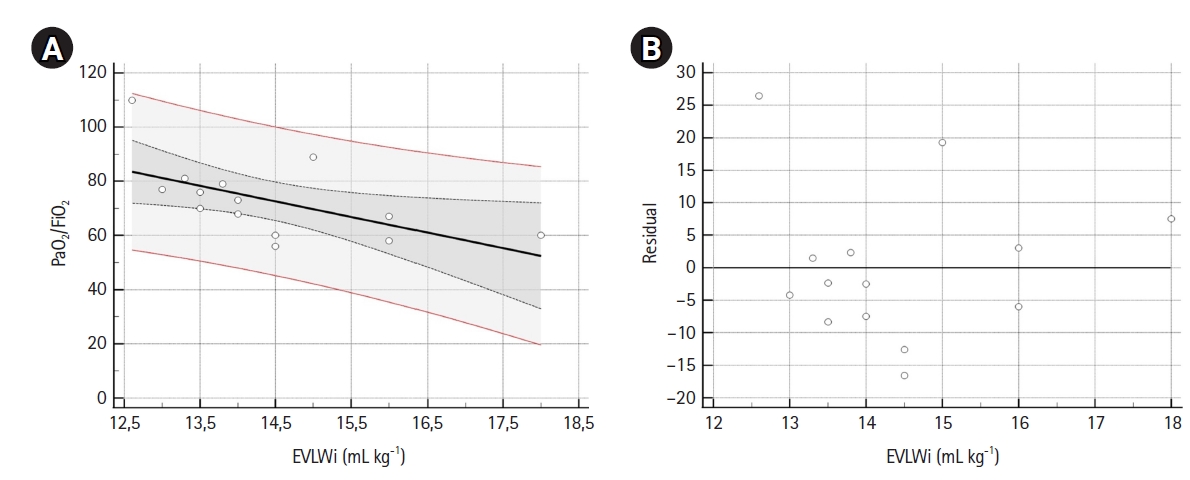
Table 1.Population characteristics
|
Variable |
Value (n=7) |
|
Female |
1 (14.3) |
|
Age (yr) |
63.7±11.3 |
|
Body mass index (kg/m2) |
27.4±2.7 |
|
Hypertension |
6 (85.7) |
|
Arrythmiaa)
|
1 (14.3) |
|
Obesity |
1 (14.3) |
|
eGFR (ml/min) |
115.1±24.1 |
|
Troponin I (ng/L) |
99.1 (39.2–263.1) |
|
Ferritin (ng/ml) |
2,408±826 |
|
Interleukin-6 (pg/ml) |
40.6 (27.7–74.1) |
|
C-reactive protein (mg/dl) |
12.2±7.0 |
|
Procalcitonin (ng/ml) |
0.26 (0.17–0.49) |
|
Fibrinogen (mg/dl) |
541.7±176.4 |
|
D-dimer (ng/ml) |
2,046 (847–2,550) |
|
AST (U/L) |
23.3±7.1 |
|
ALT (U/L) |
22.0 (19.5–66.5) |
|
PaO2/FiO2 on admission (mm Hg) |
63.1±17.8 |
Table 2.Statistical analysis results: hemodynamic and respiratory parameters
|
Parameter |
30-min Pre-pronation |
18-hr Post-pronation |
3-hr Post-supination |
ε |
P-value |
|
HR (bpm) |
77 (71–84) |
80 (66–87) |
100 (86–100) |
- |
0.038 |
|
CVP (mm Hg) |
7.7 ± 1.4 |
8.1 ± 0.7 |
8.0 ± 0.8 |
0.612 |
0.655 |
|
cardiac index (L/min/m2) |
3.6 ± 0.4 |
3.6 ± 0.8 |
3.7 ± 0.5 |
0.996 |
0.895 |
|
SVI (ml/m2) |
45.6 ± 5.1 |
46.1 ± 5.5 |
41.5 ± 6.5 |
0.992 |
0.086 |
|
GEDVi (ml/m2) |
730.8 ± 61.2 |
683.8 ± 87.8 |
699.2 ± 62.1 |
0.575 |
0.359 |
|
EVLWi (ml/kg) |
15.3 ± 1.5 |
12.7 ± 0.9 |
13.5 ± 0.6 |
0.717 |
0.004 |
|
PVPi |
3.5 ± 0.3 |
3.4 ± 0.4 |
3.6 ± 0.3 |
0.620 |
0.507 |
|
pH |
7.42 ± 0.05 |
7.43 ± 0.05 |
7.38 ± 0.07 |
0.823 |
0.335 |
|
PaCO2 (mm Hg) |
44.0 (41.0–46.5) |
45.0 (43.0–46.5) |
50.0 (49.0–50.5) |
- |
0.165 |
|
Lactate (mmol/L) |
2.3 ± 0.4 |
2.5 ± 0.5 |
2.3 ± 0.5 |
0.675 |
0.279 |
|
PaO2/FiO2 (mm Hg) |
68.4 ± 11.8 |
142.6 ± 76.1 |
77.8 ± 15.9 |
0.564 |
0.038 |
|
PEEP (cm H2O) |
10.0 (9.0–10.0) |
10.0 (10.0–10.0) |
10.0 (9.0–10.0) |
- |
0.746 |
|
Pinsp (cm H2O) |
24.7 ± 4.8 |
25.3 ± 4.4 |
25.7 ± 4.5 |
0.718 |
0.341 |
|
Driving pressure (cm H2O) |
15.3 ± 4.8 |
15.6 ± 4.7 |
16.3 ± 4.5 |
0.723 |
0.084 |
|
Respiratory rate |
19.0 ± 3.5 |
19.8 ± 3.0 |
20.2 ± 3.1 |
0.544 |
0.503 |
|
Crs (ml/cm H2O) |
28.5 ± 9.9 |
24.4 ± 10.0 |
22.8 ± 7.4 |
0.631 |
0.137 |
Table 3.Linear regression analysis results: linear regression analysis of PaO2/FiO2 and TPTD parameters
|
Variable |
Mean±SD |
Range |
Intercept (95% CI) |
β (95% CI) |
r |
R2
|
P-value (F-test) |
|
PaO2/FiO2
|
73.1±14.3 |
56.0–110.0 |
- |
- |
- |
- |
- |
|
EVLWi (ml/kg) |
14.4±1.4 |
12.6–18.0 |
156.08 (82.58 to 229.59) |
–5.76 (–10.86 to –0.68) |
–0.58 |
0.34 |
0.030 |
|
PVPi |
3.5±0.1 |
2.9–4.0 |
50.86 (–2.86 to 218.75) |
–9.78 (–40.84 to 21.27) |
–0.19 |
0.04 |
0.506 |
|
GEDVi (ml/m2) |
719.5±61.5 |
591.0–892.0 |
44.73 (37.98 to 232.90) |
–0.09 (–0.22 to 0.05) |
–0.37 |
0.14 |
0.188 |
References
- 1. Guan WJ, Ni ZY, Hu Y, Liang WH, Ou CQ, He JX, et al. Clinical characteristics of coronavirus disease 2019 in China. N Engl J Med 2020;382:1708-20.ArticlePubMed
- 2. Cummings MJ, Baldwin MR, Abrams D, Jacobson SD, Meyer BJ, Balough EM, et al. Epidemiology, clinical course, and outcomes of critically ill adults with COVID-19 in New York City: a prospective cohort study. Lancet 2020;395:1763-70.ArticlePubMedPMC
- 3. ARDS Definition Task Force; Ranieri VM, Rubenfeld GD, Thompson BT, Ferguson ND, Caldwell E, et al. Acute respiratory distress syndrome: the Berlin definition. JAMA 2012;307:2526-33.PubMed
- 4. Gattinoni L, Chiumello D, Caironi P, Busana M, Romitti F, Brazzi L, et al. COVID-19 pneumonia: different respiratory treatments for different phenotypes? Intensive Care Med 2020;46:1099-102.ArticlePubMedPMCPDF
- 5. Alhazzani W, Møller MH, Arabi YM, Loeb M, Gong MN, Fan E, et al. Surviving Sepsis Campaign: guidelines on the management of critically ill adults with Coronavirus Disease 2019 (COVID-19). Intensive Care Med 2020;46:854-87.ArticlePubMedPMCPDF
- 6. Qadri SK, Ng P, Toh TS, Loh SW, Tan HL, Lin CB, et al. Critically ill patients with COVID-19: a narrative review on prone position. Pulm Ther 2020;6:233-46.ArticlePubMedPMCPDF
- 7. Venus K, Munshi L, Fralick M. Prone positioning for patients with hypoxic respiratory failure related to COVID-19. CMAJ 2020;192:E1532-7.ArticlePubMedPMC
- 8. Vignon P, Evrard B, Asfar P, Busana M, Calfee CS, Coppola S, et al. Fluid administration and monitoring in ARDS: which management? Intensive Care Med 2020;46:2252-64.ArticlePubMedPMCPDF
- 9. Grissom CK, Hirshberg EL, Dickerson JB, Brown SM, Lanspa MJ, Liu KD, et al. Fluid management with a simplified conservative protocol for the acute respiratory distress syndrome. Crit Care Med 2015;43:288-95.ArticlePubMedPMC
- 10. National Heart, Lung, and Blood Institute Acute Respiratory Distress Syndrome (ARDS) Clinical Trials Network; Wiedemann HP, Wheeler AP, Bernard GR, Thompson BT, Hayden D, et al. Comparison of two fluid-management strategies in acute lung injury. N Engl J Med 2006;354:2564-75.ArticlePubMed
- 11. Jozwiak M, Teboul JL, Monnet X. Extravascular lung water in critical care: recent advances and clinical applications. Ann Intensive Care 2015;5:38. ArticlePubMedPMCPDF
- 12. Monnet X, Anguel N, Osman D, Hamzaoui O, Richard C, Teboul JL. Assessing pulmonary permeability by transpulmonary thermodilution allows differentiation of hydrostatic pulmonary edema from ALI/ARDS. Intensive Care Med 2007;33:448-53.ArticlePubMedPDF
- 13. Groeneveld AB, Verheij J. Extravascular lung water to blood volume ratios as measures of permeability in sepsis-induced ALI/ARDS. Intensive Care Med 2006;32:1315-21.ArticlePubMedPDF
- 14. Chung M, Bernheim A, Mei X, Zhang N, Huang M, Zeng X, et al. CT imaging features of 2019 novel coronavirus (2019-nCoV). Radiology 2020;295:202-7.ArticlePubMed
- 15. Fan E, Beitler JR, Brochard L, Calfee CS, Ferguson ND, Slutsky AS, et al. COVID-19-associated acute respiratory distress syndrome: is a different approach to management warranted? Lancet Respir Med 2020;8:816-21.ArticlePubMedPMC
- 16. Monnet X, Teboul JL. Transpulmonary thermodilution: advantages and limits. Crit Care 2017;21:147. ArticlePubMedPMCPDF
- 17. Gattinoni L, Busana M, Giosa L, Macrì MM, Quintel M. Prone positioning in acute respiratory distress syndrome. Semin Respir Crit Care Med 2019;40:94-100.ArticlePubMed
- 18. Grieco DL, Bongiovanni F, Chen L, Menga LS, Cutuli SL, Pintaudi G, et al. Respiratory physiology of COVID-19-induced respiratory failure compared to ARDS of other etiologies. Crit Care 2020;24:529. ArticlePubMedPMCPDF
- 19. Boerma EC, Bethlehem C, Stellingwerf F, de Lange F, Streng KW, Koetsier PM, et al. Hemodynamic characteristics of mechanically ventilated COVID-19 patients: a cohort analysis. Crit Care Res Pract 2021;2021:8882753. ArticlePubMedPMCPDF
- 20. Rasch S, Schmidle P, Sancak S, Herner A, Huberle C, Schulz D, et al. Increased extravascular lung water index (EVLWI) reflects rapid non-cardiogenic oedema and mortality in COVID-19 associated ARDS. Sci Rep 2021;11:11524. ArticlePubMedPMCPDF
- 21. Shi R, Lai C, Teboul JL, Dres M, Moretto F, De Vita N, et al. COVID-19 ARDS is characterized by higher extravascular lung water than non-COVID-19 ARDS: the PiCCOVID study. Crit Care 2021;25:186. ArticlePubMedPMCPDF
- 22. Asar S, Acicbe Ö, Sabaz MS, Tontu F, Canan E, Cukurova Z, et al. Comparison of respiratory and hemodynamic parameters of COVID-19 and non-COVID-19 ARDS patients. Indian J Crit Care Med 2021;25:704-8.ArticlePubMedPMC
- 23. McAuley DF, Giles S, Fichter H, Perkins GD, Gao F. What is the optimal duration of ventilation in the prone position in acute lung injury and acute respiratory distress syndrome? Intensive Care Med 2002;28:414-8.ArticlePubMedPDF
- 24. Ruste M, Bitker L, Yonis H, Riad Z, Louf-Durier A, Lissonde F, et al. Hemodynamic effects of extended prone position sessions in ARDS. Ann Intensive Care 2018;8:120. ArticlePubMedPMCPDF
- 25. Tarragón B, Valdenebro M, Serrano ML, Maroto A, Llópez-Carratalá MR, Ramos A, et al. Acute kidney failure in patients admitted due to COVID-19. Nefrologia (Engl Ed) 2021;41:34-40.ArticlePMC
- 26. Sweeney DA, Malhotra A. Coronavirus disease 2019 respiratory failure: what is the best supportive care for patients who require ICU admission? Curr Opin Crit Care 2021;27:462-7.ArticlePubMedPMC
- 27. Kushimoto S, Endo T, Yamanouchi S, Sakamoto T, Ishikura H, Kitazawa Y, et al. Relationship between extravascular lung water and severity categories of acute respiratory distress syndrome by the Berlin definition. Crit Care 2013;17:R132. ArticlePubMedPMC
- 28. Bhattacharjee A, Pradhan D, Bhattacharyya P, Dey S, Chhunthang D, Handique A, et al. How useful is extravascular lung water measurement in managing lung injury in intensive care unit? Indian J Crit Care Med 2017;21:494-9.ArticlePubMedPMC
- 29. Osuchowski MF, Winkler MS, Skirecki T, Cajander S, Shankar-Hari M, Lachmann G, et al. The COVID-19 puzzle: deciphering pathophysiology and phenotypes of a new disease entity. Lancet Respir Med 2021;9:622-42.ArticlePubMedPMC
Citations
Citations to this article as recorded by

- Determining Extracellular Water Effects in Mild and Severe COVID-19 Pneumonia Clinical Course by using the Bioimpedance Method
Zuhal Cavus, Ayse Vahaboglu, Ulku Aygen Turkmen, Habibe Vural, Dondu Genc Moralar
Medical Bulletin of Haseki.2023; 61(2): 81. CrossRef

 , Antonio Romanelli2

 PubReader
 ePub Link
 Cite
Cite


