Abstract
-
Background
- Fiberoptic endoscopic evaluation of swallowing (FEES) has been recommended to assess aspiration in stroke. This study aimed to determine the diagnostic and prognostic roles of FEES in the early assessment of aspiration, intensive care unit (ICU) stay and mortality in acute stroke patients.
-
Methods
- Fifty-two patients with acute stroke admitted to the Alexandria Main University Hospital were included. Complete examinations and assessment of aspiration using the 8-point penetration-aspiration scale (PAS) with FEES protocol were performed.
-
Results
- The patients were classified into three groups: normal with no or low risk of aspiration (n=15, 27.3%; PAS level 1), low to moderate risk (n=8, 14.5%; PAS level 2–4), and high risk (n=32, 58.2%; PAS ≥5). There was high incidence of aspiration pneumonia, prolonged ICU stay, and mortality in both moderate- and high-risk groups (P=0.001, P<0.001, and P<0.001, respectively). The PAS score predicted aspiration pneumonia (hospital-acquired pneumonia) with sensitivity and specificity of 80.0% and 76.0%, respectively (negative predictive value [NPV], 76.0; positive predictive value [PPV], 80.0; 95% confidence interval [CI], 0.706–0.940) and mortality with sensitivity and specificity of 88.46% and 68.97% (NPV, 87.0; PPV, 71.9; 95% CI, 0.749–0.951). The PAS score could predict the length of ICU stay with sensitivity and specificity of 70.21% and 87.50, respectively (NPV, 33.3; PPV, 97.1; 95% CI, 0.605–0.906).
-
Conclusions
- The standard FEES protocol using PAS score is a useful tool to assess aspiration in acute stroke patients and could be used to predict length of ICU stay and mortality.
-
Keywords: aspiration; dysphagia; penetration; pneumonia; stroke; swallowing
INTRODUCTION
Broadly, stroke has been defined as rapidly developing clinical signs of focal (at times global) disturbance of cerebral function, lasting more than 24 hours or leading to death with no apparent cause other than that of vascular origin [1]. Between 2000 and 2010, the percentage of stroke deaths decreased to 35.8% in the United States [2]. More than two-thirds of patients post-stroke receive rehabilitation services after hospitalization [3]. Stroke patients can be classified into ischemic and hemorrhagic. Ischemic strokes resulted from the loss of blood delivery to the brain, while hemorrhagic strokes resulted from a tear of a vessel or an abnormal structure of a vessel [4].
Dysphagia post-stroke is not uncommon and its early screening is a crucial part of stroke management in the acute stage. According to the studies, the swallowing abnormalities could be developed in 22% to 65% of patients, and it depends on the tool of evaluation used [5], this may continue in some patients for a long time [6,7]. Dysphagia post strokes are now considered an indicator of poor prognosis that leads to increased risks of pneumonia, nutritional problems, permanent disability, long hospital stay, and mortality [8]. In some patients improper coordination of swallowing, particles enter the airway below the vocal cords (aspiration) making feeding via the oral route a considerable risk [9]. Oropharyngeal dysfunction results in a severe form of dysphagia [10], which is a common consequence of neurological diseases including stroke [11].
The pulmonary complications resulting from aspiration are difficult to manage, and the detection of aspiration occurring during the pharyngeal phase of deglutition is important for the conditions being determined by clinical evaluation followed by examination such as videofluoroscopic or fiberoptic endoscopic evaluation of swallowing (FEES) for prognosis and rehabilitation [12]. FEES has been recommended as a useful complementary tool for studying swallowing [13]. Although FEES was conceived as an alternative to the gold standard X-ray-based video fluoroscopic swallowing study, nowadays it is established as an independent and efficient gold standard. FEES is now considered the first option of investigations in Europe because of the advantages it offers: easy to use, well-tolerated, bedside applicability examination, and less costly [14].
The penetration-aspiration scale (PAS) includes 8 points, developed by Rosenbek et al. [15], which was originally designed to detect penetration and severity of aspiration during a videofluoroscopic assessment of swallowing. The scale depends on the depth or level that material reaches into the airway passages and the airway rescue of the material. Recently, the PAS although not initially designed for such, has been used for FEES in research and clinical fields [16]. So, although not initially developed for use with FEES, the PAS gives a scalable way of estimating penetration and aspiration to discriminate abnormal from normal swallowing and to explore the effects of swallowing disorders treatment [17]. Thus the purpose of this study was to determine the study diagnostic and prognostic role of FEES in the early assessment of aspiration in acute stroke patients as a primary outcome also intensive care unit (ICU) stay and mortality as a secondary outcome.
MATERIALS AND METHODS
This observational cohort study included 52 patients who were admitted to the Main University Hospital of Alexandria with the diagnosis of acute stroke. Both genders were eligible for the study according to specific inclusion criteria that included (adult [≥18 years old] and patients with acute stroke including ischemic and hemorrhagic) and exclusion criteria that included: (patients admitted ≥48 hours after the diagnosis of acute stroke, age less than 18 years old, pregnant females, refusal to be involved in the study by patient's relatives, patients with preexisting dysphagia, Patients with severely reduced conscious level (Glasgow coma score [GCS] ≤8) and patients on mechanical ventilation.
The study was done according to the Medical Ethics Board of Alexandria Faculty of Medicine (IRB No. 00007555) and the ethical guidelines of the Declaration of Helsinki and informed consent was taken from the patient himself or his first-degree relatives. All patients enrolled in this study were completely evaluated, complete medical history was taken, complete physical examination was done, routine laboratory investigations were performed, with complete neurological examination using GCS-Full Outline of UnResponsiveness (FOUR) score [18], National Institutes of Health Stroke Scale (NIHSS), [19] and computed tomography (CT) brain on admission.
All patients were subjected to MetroHealth Dysphagia Screening and spontaneous saliva swallowing test before going to the bolus test for safety with a high-risk group of aspirations were subjected only to the non-bolus test. All patients included were subjected to clinical assessment of aspiration by MetroHealth Dysphagia Screen,endoscopic examination of swallowing using the standard protocol, and classified using the 8-point PAS. All patients were subjected to fiberoptic endoscopic dysphagia severity scale (FEDDS; score of 6 points) to detect the proper way of feeding in aspiration penetration with different materials.
Technique
Endoscopic assessment of swallowing using standard (FEES) Langmore protocol [20] within 48 hours of stroke onset after hemodynamic and respiratory stabilization using rhino-laryngo fiberscope 3.5 mm, 30 cm (Karl Storz 11302BD). (1) Application of topical anesthesia to nasal passages using 2% lidocaine solution. (2) Introduction of the fiberoptic endoscope transnasally down to the pharynx and larynx and checking their structural integrity. (3) The standard FEES protocol will be followed including (a) anatomical assessment including: base of the tongue, hypopharynx, and larynx for movement and symmetry and airway protection by assessment of glottis closure and movement of vocalcords and (b ability to swallow food and liquids. Consistency will be variable according to patient needs and problems observed. Suggested consistency to be tried includes the following: 5-ml puree consistency (vanilla pudding) and 5-ml drink of milk. (4) Administration of these consistencies will vary using syringe, spoon, or cups. Then the patients will be assessed for aspiration and classified according to the 8-point PAS (Table 1) [15].
Statistical Analysis of the Data
Data were fed to the computer and analyzed using IBM SPSS ver. 20.0. (IBM Corp., Armonk, NY, USA). The Kolmogorov-Smirnov was used to verify the normality of the distribution of variables. Comparisons between groups for categorical variables were assessed using the chi-square test (Monte Carlo). analysis of variance was used for comparing the three studied groups and followed by a post hoc test (Tukey) for pairwise comparison. Kruskal-Wallis test was used to compare different groups for abnormally distributed quantitative variables and followed by a post hoc test (Dunn's for multiple comparisons test) for pairwise comparison. Spearman coefficient was used to correlate between two distributed abnormally quantitative variables. Logistic regression was used to detect the most affecting factor for affecting the incidence of hospital-acquired pneumonia (HAP). The receiver operating characteristic (ROC) curve is generated by plotting sensitivity true positive value on Y-axis versus 1-specificity false positive value on X-axis at different cutoff values. The area under the ROC curve denotes the diagnostic performance of the test. Area more than 50% gives acceptable performance and an area of about 100% is the best performance for the test. The ROC curve allows also a comparison of performance between two tests. The significance of the obtained results was judged at the 5% level.
RESULTS
The patients were classified according to the Gugging swallowing screen and they were classified into three groups: no dysphagia (n=13, 23.7%, score 20), mild to moderate dysphagia (n=16, 29%, score of 10–19), and severe dysphagia (n=26, 47.3%, score 0–9). The patients were classified according to their PAS level into three groups: normal (PAS level score 1, n=15, 27.3%) had no dysphagia, low to moderate risk (PAS level score 2–4, n=8, 14.5%) was mild dysphagia, and high risk (PAS level score >5, n=32, 58.2%) was moderate to severe dysphagia. The patients were classified according to FEDDS for classification of the degree of severity into group A with no dysphagia (n=16, 29%), group B with mild to moderate dysphagia (n=12, 22%), and group C with severe dysphagia (n=27, 49%) and about 13 patients (23.7%) were on tube feeding.
Baseline Characteristics of Patients
Our study included 55 patients there was 31 male and 24 female. The mean age and standard deviation (SD) was 62.49±14.46 years. The mean GCS for the three groups were 11.53±1.68, 12.25±1.16, and 11.59±1.36, respectively (Figure 1). The mean FOUR score were 11.13±3.09, 12.0±2.07, and 11.03±2.74, respectively (Figure 2). The mean NIHSS were 14.13±6.52, 14.13±6.92, and 15.59±6.24), respectively (Figure 3). According to CT brain finding done on admission, we found that anterior circulation is more common 89.1% (especially right middle cerebral artery infarction 21.8% and left 38.2%) than posterior circulation stroke 10.9%. Demographic, laboratory, and clinical data of patients of different groups are shown in Table 2.
Outcome
Regarding the incidence of HAP, the correlation between HAP incidence and PAS level in the three groups showed that 30 (54.5%) including 3 in normal, 3 in low- to moderate-risk, and 24 in high risk developed aspiration pneumonia with statistical significance between the normal groups
(P=0.001). The ICU stay days were 10.27±4.20, 10.50±6.02, and 21.62±6.73 for the three groups respectively (P<0.001). Regarding mortality (n=26, 47.3%), patients including 1 in normal, 2 in low- to moderate-risk, and 23 in the high-risk group died with statistical significance between the three groups (P<0.001).
ROC Curves
The PAS level could be used to predict incidence of HAP (area under the curve [AUC], 0.823; P<0.001; 95% CI, 0.706–0.940) with sensitivity and specificity of (80.0% and 76.0%), respectively (NPV, 76.0; PPV, 80.0) (Figure 4). The PAS level could predict the length of ICU stay more than 7 days using cutoff value 3 points or more (AUC, 0.755; P=0.022; 95% CI, 0.605–0.906) with sensitivity and specificity (70.21% and 87.50%) respectively (NPV, 33.3; PPV, 97.1) (Figure 5). The PAS level could be used to predict incidence of mortality (AUC, 0.850; P<0.001; 95% CI, 0.749–0.951) with sensitivity and specificity of 88.46% and 68.97%, respectively (NPV, 87.0; PPV, 71.9) (Tables 3-5, Figure 6).
DISCUSSION
Dysphagia occurs in many neurological disorders and frequently detects the outcome [21]. Stroke is considered the most frequent cause. This study found that FEES plays an important diagnostic and prognostic role in the early assessment of aspiration, ICU stays, and mortality in acute stroke. using PAS level we found three groups: the normal group (PAS level score 1, n=15, 27.3%) had no dysphagia; low risk (PSA level score 2–4, n=8, 14.5%) was mild dysphagia; and high risk (PSA level score >5, n=32, 58.2%) was moderate to severe dysphagia. The mean ICU stay was (10.27±4.20, 10.50±6.02, and 21.62±6.73 days; P<0.001) for the three groups, respectively, and mortality (n=26, 47.3%) patients including 1 in normal, 2 in low- to moderate-risk, and 23 in high-risk group died with statistical significance between the three groups (P<0.001).
Regarding demographic data in the current study, there was an increased percentage of stroke incidence in males more than in females, this might be due to the effect of sex steroid hormones on cerebral vasculature, but without statistical significance among the three groups. This is coinciding with other studies that described the same male predominance as in Grau et al.’s study [22].
The current study demonstrated that acute stroke occurred more frequently in people over the age of 60 among the three groups, this was statistically significant at P<0.05 and that was because people over 60 years had more risk factors. In contrast to our study as regard age, Singh et al. [23] found no statistical difference as regards age in acute ischemic stroke. Ovbiagele et al. [24] was evaluating the role of recent smoking in prognosis after acute ischemic stroke. They found that smokers had increased poor functional outcomes regardless of other statistically significant factors, so they mentioned that smokers developed poorer outcomes than nonsmokers after 3 months of acute ischemic stroke. Similarly, in the current study, there was an increased percentage of smokers among stroke patients.
In the current study, there was an increased percentage of diabetics and mortality especially in the high compared with normal and low-risk groups. Similarly, Hamidon and Raymond [25] evaluated the characteristics of stroke in patients with diabetes mellitus and those without. They concluded that diabetes was a significant indicator of mortality and poor level of consciousness in stroke patients. Mortality is also significantly attributed to increased blood glucose levels at admission. For comparing the FESS results, they were classified using the PAS of Rosenbek et al. [15]. The highest point reached in either the fluids or the semisolids was considered the last score. As the cutoff value for validation, similarly, in our study, we chose the risk aspiration versus minimal or no aspiration to classify patients using PAS. For the FEES, therefore, the PAS target value was between levels 4 and 5 at the level of laryngeal penetration of particles (fluids or semisolid) reaching the vocal folds. The capability of bringing out these particles from the airway passages was therefore the crucial point for risk of aspiration.
Trapl et al. [26] found that classification of dysphagia using PAS, three patients (16%) developed no dysphagia (PAS score, 1–2), three patients (16%) developed mild dysphagia (PAS, 3–4), four patients (21%) developed moderate dysphagia (PAS, 5–6), and almost (50%) of the studied group had severe dysphagia (9 patients, 47%, PAS, 7–8). Similarly, in our study, we found that according to PAS dysphagia classification patient’s risk of dysphagia and hence aspiration was: normal (PAS level score 1, n=15, 27.3%) had no dysphagia, low risk (PAS level score 2–4, n=8, 14.5%) was mild dysphagia, and high risk (PAS level score >5, n=32, 58.2%) was moderate to severe dysphagia. However, due to the apparent lack of ordinarily, we categorized the PAS into such three groups as a definitive scale or what is known as (“categorical PAS”). Similarly, a retrospective study reported by Pikus et al. [27] concluded that classification of airway violation by depth (i.e., PAS level 1 vs. levels 2–5, levels 6–7, and level 8) are accompanied by the relative risk of aspiration pneumonia. However, many other studies mentioned that it is not a linear relationship [28]. Many subsequent trials continue to mention that level 4 and 6 PAS scores is exceptionally rare [29].
Our study showed that dysphagia patients had a slightly higher NIHSS on admission, especially among the high-risk group in comparison to the two other groups without statistical significance (high-risk group: mean±SD, 15.54±6.24). This coincides with results by Dziewas et al. [30], who showed that patients with an NIHSS >3 had signs of penetration and aspiration, and the different cutoff value, might be due to the different sample size, the type of studied population, use of formal dysphagia screening form for all patients and excluding those who are not eligible to the bolus testing and timing of the test (done early within 48 hours) because although NIHSS is predictive it is not sufficiently sensitive to be used as a treatment of the disorder and complimentary assessment needed [31].
Ifejika-Jones et al. [32] reported the relationship between the occurrence of aspiration pneumonia and NIHSS, where they were more prone to need post-acute stroke care. In contrast, our study showed no association between the incidence of pneumonia and NIHSS in the three studied groups and this might be due to different sample sizes and different baseline characteristics. The early management of stroke-like tissue plasminogen activator is associated with increased recovery from stroke symptoms by up to 50% (tissue plasminogen activator for acute ischemic stroke) [33].
In our study, we found that GCS was slightly lower in a high-risk group of dysphagia but with no statistical significance between the three groups in contrast to Walter et al. [34] showed that GCS was significantly associated with the presence or absence of dysphagia using cutoff value 13 point and this difference in our study might be due to different sample size, type of the studied population, the presence of other factors affecting post-stroke pneumonia such as commensal gut bacterial translocation and dissemination as a novel pathway for post-stroke pneumonia and not only dysphagia severity using NIHSS and also may be due to stroke laterality and distribution, for example, anterior cerebral region stroke associated with more severe oropharyngeal dysphagia is more common.
Kwan and Hand [35] mentioned that infection occurring post-stroke could prolong the duration of stay of patients, in the acute stage of stroke. Similarly, in the current study, there was a prolonged length of hospital stay among patients with pneumonia, especially in the high-risk group using the cutoff value (PAS ≥3). Komiya et al. [36] showed that aspiration pneumonia was related to short and long-term mortality. Similarly, our study showed a high incidence of mortality among the high-risk group of dysphagia (P<0.001) in comparison to normal and low-risk groups.
In our study univariate and multivariate analysis using age, GCS, FOUR score NIHSS, PAS level as risk factors for aspiration pneumonia showed that only PAS level is an independent indicator of pneumonia (P<0.001; OR, 1.631; 95% CI, 1.276–2.084). In contrast to Nedeltchev et al. [37] regression analysis found that only the NIHSS is an independent indicator of pneumonia. This might be due to different sample sizes and different types of the studied population. Similarly, our study found that higher admission NIHSS, lower GCS, lower FOUR score, dysphagia especially high-risk group (PAS level >5) all are predictors of mortality. In our study, we performed logistic regression and not a linear regression and only the univariate regression analysis showed that PAS is an independent indicator of pneumonia (P<0.001).
Advantages and Disadvantages
Although our study had many advantages such as studying the population from the main university hospital which represents a tertiary center, a representative sample with no selection bias, and all patients selected consequently, we have many limitations as it is a prospective observational study, so we cannot detect true causal association as in the analytic study. We just detected the association, also further research is to be conducted on a larger study sample. The standard FEES protocol using PAS could be used for the evolution of aspiration risk in patients with acute stroke with high sensitivity and specificity, also it could predict the length of ICU stay and mortality.
KEY MESSAGE
▪ In acute stroke dysphagia is considered an indicator of poor prognosis that may lead to an increased risk of aspiration pneumonia.
▪ Fiberoptic endoscopic evaluation of swallowing has been recommended, as a useful complementary tool for studying swallowing in acute stroke.
NOTES
-
CONFLICT OF INTEREST No potential conflict of interest relevant to this article was reported.
-
AUTHOR CONTRIBUTIONS
Conceptualization: AMF, MMASM. Data curation: MSE, AME. Formal analysis: MSE, AMF, MMASM. Methodology: MSE, NHH. Project administration: MSE, AME. Visualization: MSE, MMASM, NHH, AME. Writing–original draft: MSE. Writing–review & editing: MSE, AMF, MMASM, NHH.
Acknowledgments
This study was supported by both Critical Care and Otorhinolaryngology Departments of Alexandria University. We are greatly indebted to the nursing staff and critical care residents in Alexandria Critical Care Department for their unwavering assistance caring for patients selected in the study.
Figure 1.Correlation between penetration-aspiration scale (PAS) levels with Glasgow coma score (GCS). aSpearman correlation.
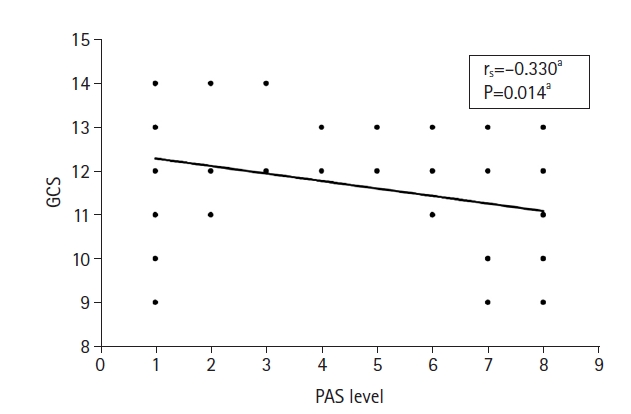
Figure 2.Correlation between penetration-aspiration scale (PAS) levels with Full Outline of UnResponsiveness (FOUR) score. aSpearman correlation.
Figure 3.Correlation between penetration-aspiration scale (PAS) levels with National Institutes of Health Stroke Scale (NIHSS). aSpearman correlation.
Figure 4.Receiver operating characteristic curve for penetration-aspiration scale level to predict incidence of hospital-acquired pneumonia. AUC: area under the curve.
Figure 5.Receiver operating characteristic curve for penetration-aspiration scale level to predict intensive care unit stay more than 7 days. AUC: area under the curve.
Figure 6.Receiver operating characteristic curve for penetration-aspiration scale level to predict mortality. AUC: area under the curve.
Table 1.Penetration aspiration scale
|
Score |
Description |
|
1 |
Material does not enter the airway. |
|
2 |
Material enters the airway, remains above the vocal folds, and is ejected from the airway. |
|
3 |
Material enters the airway, remains above the vocal folds, and is not ejected from the airway. |
|
4 |
Material enters the airway, contacts the vocal folds, and is ejected from the airway. |
|
5 |
Material enters the airway, contacts the vocal folds, and is not ejected from the airway. |
|
6 |
Material enters the airway, passes below the vocal folds, and is ejected into the larynx or out of the airway. |
|
7 |
Material enters the airway, passes below the vocal folds, and is not ejected from the trachea despite effort. |
|
8 |
Material enters the airway, passes below the vocal folds, and no effort is made to eject. |
Table 2.Relation between PAS level and different parameters
|
Variable |
Normal group (PAS level 1) |
Low- to moderate-risk (PAS level 2–4) |
High-risk group (PAS level ≥5) |
Test of sig. |
P-value |
|
Age (yr) |
52.7b±12.3 |
64a,b±7.2 |
66.1a±15.8 |
F= 4.981c
|
0.010c
|
|
Male:female |
9a:7a
|
1b:7b
|
19a:12a
|
χ2=6.063c
|
MCP=0.046c
|
|
GCS |
12.1a,b±1.7 |
12.5a±1.1 |
11.2b±1.4 |
F=3.378c
|
0.042c
|
|
FOUR score |
13.1a±1.8 |
12.5a±1.3 |
9.9b±2.7 |
F=11.21c
|
<0.001c
|
|
NIHSS |
10.7b±3.9 |
9.8b±4.2 |
18.4a±5.6 |
F=17.56c
|
<0.001c
|
|
Hb (mg/dl) |
11.6a±1.9 |
11.5a±2.1 |
11a±2.2 |
F=0.492 |
0.614 |
|
WBC (×106/L) |
15a (4.4–27) |
18.5a (8–24) |
13a (4.5–33) |
H=4.070 |
0.131 |
|
Platelet (×109/L) |
326.5a (90–550) |
280a (121–400) |
322a (89–552) |
H=0.733 |
0.693 |
|
INR |
1.13ab±0.2 |
1.05b±0.1 |
1.3a±0.2 |
F=5.367c
|
0.008c
|
|
Na (mEq/L) |
137.1a±4.6 |
139.1a±3.1 |
138.8a±5.5 |
F=0.738 |
0.483 |
|
K (mEq/L) |
3.7a±0.4 |
3.6a±0.5 |
3.8a±0.4 |
F=1.336 |
0.272 |
|
Urea (mg/dl) |
37.1a±8.8 |
39a±7.9 |
42.5a±14 |
F=1.106 |
0.338 |
|
Creatinine (mg/dl) |
1a (0.5–1.5) |
0.8a (0.5–1.2) |
1a (0.3–2) |
H=3.783 |
0.151 |
|
Respiratory rate (beats/min) |
20.6a±2.7 |
23a±4 |
20.3a±3.4 |
F=2.185 |
0.123 |
|
Heart rate (beats/min) |
89.6a±13.5 |
81.1a±19.4 |
95.8a±18.3 |
F=2.525 |
0.090 |
|
Systolic blood pressure (mm Hg) |
139.4a±22.1 |
155a±22.7 |
144.4a±19.9 |
F=1.484 |
0.236 |
|
Diastolic blood pressure (mm Hg) |
83.1a±12.5 |
83.8a±16 |
84.5a±11.8 |
F=0.066 |
0.936 |
|
Temperature (°C) |
37.4a±0.4 |
37.6a±0.5 |
37.6a±0.6 |
F=0.618 |
0.543 |
Table 3.Agreement (sensitivity and specificity) for PAS level to predict incidence of HAP
|
Cut-off |
Sensitivity, % (95% CI) |
Specificity, % (95% CI) |
PPV |
NPV |
|
|
>3 |
86.7 (69.3–96.2) |
68.0 (46.5–85.1) |
76.5 |
81.0 |
|
|
>4 |
80.0 (61.4–92.3) |
68.0 (46.5–85.1) |
75.0 |
73.9 |
|
|
>5 |
80.0 (61.4–92.3) |
76.0 (54.9–90.6) |
80.0 |
76.0 |
|
|
>6 |
66.7 (47.2–82.7) |
88.0 (68.8–97.5) |
87.0 |
68.7 |
|
|
>7 |
36.7 (19.9–56.1) |
92.0 (74.0–99.0) |
84.6 |
54.8 |
|
Table 4.Correlation between PAS levels with ICU stay more than 7 days
|
Cut-off |
Sensitivity, % (95% CI) |
Specificity, % (95% CI) |
PPV |
NPV |
|
|
>1 |
76.6 (62.0–87.7) |
50.0 (15.7–84.3) |
90.0 |
26.7 |
|
|
>2 |
70.2 (55.1–82.7) |
62.5 (24.5–91.5) |
91.7 |
26.3 |
|
|
>3 |
70.2 (55.1–82.7) |
87.5 (47.3–99.7) |
97.1 |
33.3 |
|
|
>4 |
66.0 (50.7–79.1) |
87.5 (47.3–99.7) |
96.9 |
30.4 |
|
|
>5 |
61.7 (46.4–75.5) |
87.5 (47.3–99.7) |
96.7 |
28.0 |
|
|
>6 |
46.8 (32.1–61.9) |
87.5 (47.3–99.7) |
95.7 |
21.9 |
|
Table 5.Agreement (sensitivity and specificity) for PAS level to predict mortality
|
Cut-off |
Sensitivity (95% CI) |
Specificity (95% CI) |
PPV |
NPV |
|
|
>2 |
88.5 (69.8–97.6) |
55.2 (35.7–73.6) |
63.9 |
84.2 |
|
|
>3 |
88.5 (69.8–97.6) |
62.1 (42.3–79.3) |
67.6 |
85.7 |
|
|
>4 |
88.5 (69.8–97.6) |
69.0 (49.2–84.7) |
71.9 |
87.0 |
|
|
>5 |
80.8 (60.6–93.4) |
69.0 (49.2–84.7) |
70.0 |
80.0 |
|
|
>6 |
69.2 (48.2–85.7) |
82.8 (64.2–94.2) |
78.3 |
75.0 |
|
References
- 1. Furie KL, Kasner SE, Adams RJ, Albers GW, Bush RL, Fagan SC, et al. Guidelines for the prevention of stroke in patients with stroke or transient ischemic attack: a guideline for healthcare professionals from the American Heart Association/American Stroke Association. Stroke 2011;42:227-76.ArticlePubMed
- 2. Mozaffarian D, Benjamin EJ, Go AS, Arnett DK, Blaha MJ, Cushman M, et al. Heart disease and stroke statistics: 2015 update: a report from the American Heart Association. Circulation 2015;131:e29-322.PubMed
- 3. Buntin MB, Colla CH, Deb P, Sood N, Escarce JJ. Medicare spending and outcomes after postacute care for stroke and hip fracture. Med Care 2010;48:776-84.ArticlePubMedPMC
- 4. Lloyd-Jones D, Adams R, Carnethon M, De Simone G, Ferguson TB, Flegal K, et al. Heart disease and stroke statistics: 2009 update: a report from the American Heart Association Statistics Committee and Stroke Statistics Subcommittee. Circulation 2009;119:e21-181.PubMed
- 5. Daniels SK, Brailey K, Priestly DH, Herrington LR, Weisberg LA, Foundas AL. Aspiration in patients with acute stroke. Arch Phys Med Rehabil 1998;79:14-9.ArticlePubMed
- 6. Nilsson H, Ekberg O, Olsson R, Hindfelt B. Dysphagia in stroke: a prospective study of quantitative aspects of swallowing in dysphagic patients. Dysphagia 1998;13:32-8.ArticlePubMed
- 7. Holas MA, DePippo KL, Reding MJ. Aspiration and relative risk of medical complications following stroke. Arch Neurol 1994;51:1051-3.ArticlePubMed
- 8. Smithard DG, O’Neill PA, Parks C, Morris J. Complications and outcome after acute stroke: does dysphagia matter? Stroke 1996;27:1200-4.ArticlePubMed
- 9. Horner J, Massey EW. Silent aspiration following stroke. Neurology 1988;38:317-9.ArticlePubMed
- 10. Sellars C, Bowie L, Bagg J, Sweeney MP, Miller H, Tilston J, et al. Risk factors for chest infection in acute stroke: a prospective cohort study. Stroke 2007;38:2284-91.ArticlePubMed
- 11. Leder SB, Espinosa JF. Aspiration risk after acute stroke: comparison of clinical examination and fiberoptic endoscopic evaluation of swallowing. Dysphagia 2002;17:214-8.ArticlePubMed
- 12. Doggett DL, Tappe KA, Mitchell MD, Chapell R, Coates V, Turkelson CM. Prevention of pneumonia in elderly stroke patients by systematic diagnosis and treatment of dysphagia: an evidence-based comprehensive analysis of the literature. Dysphagia 2001;16:279-95.ArticlePubMed
- 13. Langmore SE, Schatz K, Olsen N. Fiberoptic endoscopic examination of swallowing safety: a new procedure. Dysphagia 1988;2:216-9.ArticlePubMed
- 14. Aviv JE, Kaplan ST, Thomson JE, Spitzer J, Diamond B, Close LG. The safety of flexible endoscopic evaluation of swallowing with sensory testing (FEESST): an analysis of 500 consecutive evaluations. Dysphagia 2000;15:39-44.ArticlePubMed
- 15. Rosenbek JC, Robbins JA, Roecker EB, Coyle JL, Wood JL. A penetration-aspiration scale. Dysphagia 1996;11:93-8.ArticlePubMed
- 16. Butler SG, Stuart A, Leng X, Rees C, Williamson J, Kritchevsky SB. Factors influencing aspiration during swallowing in healthy older adults. Laryngoscope 2010;120:2147-52.ArticlePubMedPMC
- 17. Butler SG, Stuart A, Case LD, Rees C, Vitolins M, Kritchevsky SB. Effects of liquid type, delivery method, and bolus volume on penetration-aspiration scores in healthy older adults during flexible endoscopic evaluation of swallowing. Ann Otol Rhinol Laryngol 2011;120:288-95.ArticlePubMed
- 18. Wijdicks EF, Bamlet WR, Maramattom BV, Manno EM, McClelland RL. Validation of a new coma scale: the FOUR score. Ann Neurol 2005;58:585-93.ArticlePubMed
- 19. Kwah LK, Harvey LA, Diong J, Herbert RD. Models containing age and NIHSS predict recovery of ambulation and upper limb function six months after stroke: an observational study. J Physiother 2013;59:189-97.ArticlePubMed
- 20. Langmore S. Endoscopic evaluation and treatment of swallowing disorders. 2nd ed. New York: Thieme; 2001.
- 21. Singh S, Hamdy S. Dysphagia in stroke patients. Postgrad Med J 2006;82:383-91.ArticlePubMedPMC
- 22. Grau AJ, Weimar C, Buggle F, Heinrich A, Goertler M, Neumaier S, et al. Risk factors, outcome, and treatment in subtypes of ischemic stroke: the German stroke data bank. Stroke 2001;32:2559-66.ArticlePubMed
- 23. Singh P, Yan J, Hull R, Read S, O’Sullivan J, Henderson RD, et al. Levels of phosphorylated axonal neurofilament subunit H (pNfH) are increased in acute ischemic stroke. J Neurol Sci 2011;304:117-21.ArticlePubMed
- 24. Ovbiagele B, Weir CJ, Saver JL, Muir KW, Lees KR, IMAGES Investigators. Effect of smoking status on outcome after acute ischemic stroke. Cerebrovasc Dis 2006;21:260-5.ArticlePubMed
- 25. Hamidon BB, Raymond AA. The impact of diabetes mellitus on in-hospital stroke mortality. J Postgrad Med 2003;49:307-10.PubMed
- 26. Trapl M, Enderle P, Nowotny M, Teuschl Y, Matz K, Dachenhausen A, et al. Dysphagia bedside screening for acute-stroke patients: the Gugging Swallowing Screen. Stroke 2007;38:2948-52.ArticlePubMed
- 27. Pikus L, Levine MS, Yang YX, Rubesin SE, Katzka DA, Laufer I, et al. Videofluoroscopic studies of swallowing dysfunction and the relative risk of pneumonia. AJR Am J Roentgenol 2003;180:1613-6.ArticlePubMed
- 28. Ribeiro PW, Cola PC, Gatto AR, da Silva RG, Luvizutto GJ, Braga GP, et al. Relationship between dysphagia, National Institutes of Health Stroke Scale score, and predictors of pneumonia after ischemic stroke. J Stroke Cerebrovasc Dis 2015;24:2088-94.ArticlePubMed
- 29. Kelly AM, Drinnan MJ, Leslie P. Assessing penetration and aspiration: how do videofluoroscopy and fiberoptic endoscopic evaluation of swallowing compare? Laryngoscope 2007;117:1723-7.ArticlePubMed
- 30. Dziewas R, Warnecke T, Olenberg S, Teismann I, Zimmermann J, Kramer C, et al. Towards a basic endoscopic assessment of swallowing in acute stroke: development and evaluation of a simple dysphagia score. Cerebrovasc Dis 2008;26:41-7.ArticlePubMed
- 31. Jeyaseelan RD, Vargo MM, Chae J. National Institutes of Health Stroke Scale (NIHSS) as an early predictor of poststroke dysphagia. PM R 2015;7:593-8.ArticlePubMed
- 32. Ifejika-Jones NL, arun N, Peng H, Elizabeth A, Grotta JC, Francisco GE. The interaction of aspiration pneumonia with demographic and cerebrovascular disease risk factors is predictive of discharge level of care in acute stroke patient. Am J Phys Med Rehabil 2012;91:141-7.PubMed
- 33. National Institute of Neurological Disorders, Stroke rt-PA Stroke Study Group. Tissue plasminogen activator for acute ischemic stroke. N Engl J Med 1995;333:1581-7.ArticlePubMed
- 34. Walter U, Knoblich R, Steinhagen V, Donat M, Benecke R, Kloth A. Predictors of pneumonia in acute stroke patients admitted to a neurological intensive care unit. J Neurol 2007;254:1323-9.ArticlePubMed
- 35. Kwan J, Hand P. Infection after acute stroke is associated with poor short-term outcome. Acta Neurol Scand 2007;115:331-8.ArticlePubMed
- 36. Komiya K, Rubin BK, Kadota JI, Mukae H, Akaba T, Moro H, et al. Prognostic implications of aspiration pneumonia in patients with community acquired pneumonia: a systematic review with meta-analysis. Sci Rep 2016;6:38097. ArticlePubMedPMC
- 37. Nedeltchev K, Renz N, Karameshev A, Haefeli T, Brekenfeld C, Meier N, et al. Predictors of early mortality after acute ischaemic stroke. Swiss Med Wkly 2010;140:254-9.PubMed
Citations
Citations to this article as recorded by

- Aspiration Pneumonia
Di Pan, Samuel Chung, Erik Nielsen, Michael S. Niederman
Seminars in Respiratory and Critical Care Medicine.2024; 45(02): 237. CrossRef - The use of videofluoroscopy (VFS) and fibreoptic endoscopic evaluation of swallowing (FEES) in the investigation of oropharyngeal dysphagia in stroke patients: A narrative review
K. Helliwell, V.J. Hughes, C.M. Bennion, A. Manning-Stanley
Radiography.2023; 29(2): 284. CrossRef

 , Akram Muhammad Fayed1, Mohamed Mostafa Abdel Salam Megahed1

 PubReader
 ePub Link
 Cite
Cite

