Abstract
-
Background
- Malnutrition is a serious condition in critically ill patients. The aim of this study is to evaluate the relationships between the Onodera’s prognostic nutritional index (OPNI) and intestinal permeability and between OPNI and systemic inflammation in critically ill patients.
-
Methods
- This was a cross-sectional study conducted in the general intensive care unit (ICU) of a university-affiliated hospital. A total of 162 patients admitted between May 2018 and December 2019, was included in the study. The OPNI was calculated at admission and categorized as ≤40 or >40. We assessed plasma endotoxin and zonulin concentrations as markers of intestinal permeability as well as serum interleukin-6 (IL-6) and high-sensitivity C-reactive protein (hs-CRP) as markers of systemic inflammation upon admission under stringent conditions. The relationships between these markers and OPNI were assessed after adjusting for potential confounders through estimation of a binary logistic regression model.
-
Results
- Median (interquartile range) hs-CRP, IL-6 zonulin, and endotoxin were significantly greater in the low OPNI subgroup than in the high OPNI subgroup (all P<0.05). Multivariate analyses showed significant association between serum IL-6 (odds ratio [OR], 0.88; 95% confidence interval [CI], 0.64–0.96), serum hs-CRP (OR, 0.77; 95% CI, 0.53–0.92), plasma endotoxin (OR, 0.81; 95% CI, 0.72–0.93), and plasma zonulin (OR, 0.83; 95% CI, 0.75–0.98) levels with OPNI in the overall population.
-
Conclusions
- Our results provide evidence that higher plasma endotoxin, zonulin, IL-6, and hs-CRP levels are associated with progressively lower OPNI in mixed ICU populations, particularly in surgical ICU patients.
-
Keywords: C-reactive protein; endotoxin; intensive care unit; interleukin-6; zonulin; Onodera
INTRODUCTION
Malnutrition is a common unfavorable complication in critically ill patients [1]. According to previous studies, about two-thirds of patients admitted to intensive care units (ICUs) are malnourished [2]. Inadequate nutritional delivery can result in increased morbidity and mortality in malnourished ICU patients [3,4].
Delaying initiation of nutrition support can significantly increase inflammation and impair intestinal barrier function, which can lead to intestinal atrophy and bacterial translocation [5]. Critically ill patients with pre-existing systemic inflammatory state experience severe catabolic stress [6]. An inflammatory response is induced following injury to maintain homeostasis [7]. Widespread inflammation in systemic inflammatory response syndrome is usually present in areas remote from the site of initial injury [7]. Bacterial translocation is commonly associated with septic complications [8]. It has been proposed that bacterial translocation and the presence of systemic inflammation are involved in the pathogenesis of systemic infectious complications and multiple organ deficiency syndromes [8].
Nutrition assessment in critically ill patients is crucial for classifying nutritional status, identifying nutritional problems, and monitoring nutritional support adequacy [9]. Most importantly, establishing early nutrition-related prognoses in patients is pivotal to oversee nutritional progress and distinguish patients at risk of complications and who would benefit from particular nutrition interventions [9,10]. An ideal nutrition index is calculated to accurately evaluate nutritional status in critically ill patients. In clinical practice, the Onodera’s prognostic nutritional index (OPNI) is widely used as a simple and cost-effective index to evaluate patient nutritional status [11]. It was initially developed by Onodera et al. [11] to predict the risk of postoperative complications after gastrointestinal surgery. OPNI has been shown to predict prognosis in different types of cancer [12-15]. It is simple formula to assess total lymphocyte count and serum albumin [11], with lower OPNI scores associated with poorer outcomes [16,17]. As one of the simplest and most commonly used measures, it is a valuable nutritional index to evaluate the nutritional status of critically ill patients.
There is much debate regarding whether associations exist between nutritional status and inflammation and nutritional status and intestinal permeability in critically ill patients. We hypothesized that critically ill patients with low OPNI have increased intestinal permeability and systemic inflammation, as well as worse clinical outcomes. However, our current knowledge for critically ill patients is rudimentary. Thus, the current study has two main objectives. The first is to assess the relationships between levels inflammatory and intestinal permeability factors at admission with OPNI score in critically ill patients. The second is to identify possible associations of clinical outcomes with OPNI.
MATERIALS AND METHODS
Study Design and Participants
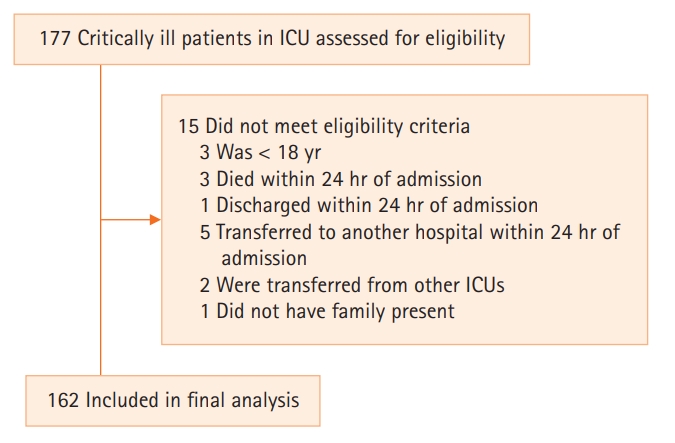
We conducted a cross-sectional study between May 1, 2018, and December 31, 2019, in the mixed ICU of a university-affiliated hospital. Inclusion criteria were age 18 and above and admitted to the ICU. Patients were excluded if they were discharged within 24 hours of ICU admission or died and if they were transferred from other ICUs. A total of 162 patients was enrolled within 24 hours of ICU admission. All clinical and demographic data were collected from the first admission for those who were readmitted to the ICU. Reasons for hospitalization were classified as either medical or surgical.
Baseline Characteristics and Clinical Measurements
Baseline demographic information, laboratory data, and past medical history including detailed lists of laboratory values and comorbidities were collected by investigators blinded to clinical outcomes. Acute Physiology and Chronic Health Evaluation (APACHE) II and Sequential Organ Failure Assessment (SOFA) scores [18,19] were recorded within the first 24 hours of admission to ICU. Venous blood was collected in ethylenediaminetetraacetic acid-containing tubes from an antecubital vein during the morning of the first day of admission in the ICU. Plasma was separated by centrifugation at 3,000 rpm for 10 minutes at 4℃ within 30 minutes of collection. Then, both plasma and serum samples were snap-frozen and stored in small aliquots at –80℃ to prevent repeated freezing and thawing until measurement of laboratory data. A commercially available human interleukin-6 (IL-6) enzyme-linked immunosorbent assay (ELISA) kit (Bender Medsystems, Burlingame, CA, USA) was used to measure serum IL-6. Plasma zonulin level was analyzed by ELISA (Immundiagnostik, Bensheim, Germany), and plasma endotoxin levels were measured by a commercially available quantitative chromogenic endpoint Limulus amoebocyte lysate QCL-1000 kit (Lonza, Walkersville, MD, USA). In addition, an ELISA kit was used to estimate high-sensitivity C-reactive protein (hs-CRP) (Diagnostics Biochem, London, ON, Canada). All laboratory tests were performed using the same blood sample for each patient. All tests were carried out in duplicate, and all assays were utilized as recommended by the manufacturers.
The OPNI for each patient was calculated using the formula: OPNI=10×albumin (g/dl)+0.005×total lymphocyte count/μL as measured in peripheral blood, with a reference value ≤40 [11]. Serum albumin and lymphocyte count were measured within 24 hours of admission to the ICU. Clinical outcomes, including incidence of sepsis according to American College of Chest Physicians and the Society of Critical Care Medicine criteria [20] during the ICU stay, mortality in the ICU, and length of stay in the ICU were recorded.
Ethical Statement
The study was supported by grant NO 1395/74351 from the Shahid Beheshti University of Medical Sciences. All procedures performed in studies involving human participants were in accordance with the ethical standards laid down in the 1964 Declaration of Helsinki and its later amendments. Informed consent was obtained from the legal representatives of eligible patients according to local regulations. This study was reviewed and approved by the ethics committee of Shahid Beheshti University of Medical Sciences with Ethical approval (No. IR.SBMU.RETECH.REC.1395.860).
Statistical Analysis
All statistical analyses were carried out using IBM SPSS ver. 20 (IBM Corp., Armonk, NY, USA). The significance level of all tests was targeted at 0.05. Characteristics of the study population were analyzed by descriptive statistics. Data were expressed as percentages and frequencies or described as medians and interquartile range (IQR) for continuous variables not normally distributed and highly skewed. Using OPNI as the categorical variable, patients were placed into two categories: high OPNI (>40) and low OPNI (≤40). The differences in distributions of categorical variables were assessed using chi-square test, whereas the Mann-Whitney test was used to assess differences in the distributions of continuous variables. Univariate binary logistic regression was used to explore relationships between OPNI and intestinal permeability (zonulin and endotoxin levels) or inflammatory factors (hs-CRP, IL-6) for the overall population and by admission category. Multiple logistic regression models were adjusted for age and used to determine relationships between exploratory variables and OPNI with adjustment for potential confounders. Initially, a partially adjusted model included age. A fully adjusted model added APACHE II. Variance inflation factor was used to detect collinearity in the final model.
RESULTS
The final analyses were conducted in a sample of 162 critically ill patients (Figure 1). Demographic and clinical characteristics of the 162 included patients are listed in Table 1, overall and by OPNI. The median age of participants was 65 years (IQR, 49–75), and 54% were male. Overall, 63% of patients were classified as low nutritional status according to OPNI.
Patients were dichotomized based on OPNI cut-off. The median age of patients with low or high OPNI was 69.5 years (IQR, 51–79 years) and 58 years (IQR, 49–70 years), respectively (P=0.002). There were no significant differences in APACHE II score and SOFA score between the two OPNI subgroups (P=0.066 and P=0.519, respectively). At admission, there was a statistically significant difference between low and high OPNI subgroups (P=0.021). As expected, compared to patients with high OPNI, the low OPNI subgroup had significantly lower serum albumin (P<0.001) and lower lymphocyte count (P<0.001). The median (IQR) serum IL-6 of participants was 318 pg/ml (96–477 pg/ml) and 157 pg/ml (43–422 pg/ml) in low and high OPNI subgroups, respectively, demonstrating a significant difference (P<0.001). The median (IQR) serum hs-CRP was significantly greater in the low OPNI subgroup than in patients with high OPNI (P=0.006). Those with low OPNI exhibited significantly higher plasma zonulin and plasma endotoxin values compared with those with high OPNI (P<0.001 for both comparisons).
Multivariate analyses using binary logistic regression (OPNI classification: low or high) demonstrated significant relationship between higher plasma zonulin level and lower OPNI with adjusted odds ratio (OR) 0.83 (95% confidence interval [CI], 0.75–0.98) in the overall population, OR 0.81 (95% CI, 0.78–0.96) in the surgical group, and OR 0.91 (95% CI, 0.89–1.21) in the medical group (Table 2). A significant negative association between endotoxemia and decreasing OPNI category was demonstrated in the overall population (OR, 0.81; 95% CI, 0.72–0.93) and in the surgical group (OR, 0.79; 95% CI, 0.75–0.89) (Table 2).
In the first model, there was a significant negative association of IL-6 with OPNI category in the overall population and in both surgical and medical groups. However, the association remained significant only in the overall population (OR, 0.88; 95% CI, 0.64-0.96) and in the surgical group (OR, 0.80; 95% CI, 0.60–0.88) after adjustments for potential confounders (Table 2). An inverse correlation was found between hs-CRP level and OPNI category in the overall population and in both surgical and medical groups, which are demonstrated in the first and second models (Table 2).
There was statistically significant difference in the incidence of new severe sepsis between OPNI categories. Overall, 28.4% of those in the low OPNI group versus 13.3% in the high OPNI group had new severe sepsis (P=0.027). There were no statistically significant differences for mortality in ICU between the low OPNI group (18.6%) and the high OPNI group (13.3%) (P=0.027). The median (IQR) length of stay in ICU was 17 (10–29) days and 11 (6–24) days for the low OPNI group and the high OPNI group, respectively (P=0.042).
DISCUSSION
This study was conducted to assess the association of inflammation factors and intestinal permeability with nutritional status index (OPNI) in critically ill patient. Based on our literature review, potential associations of markers of intestinal permeability and inflammation with OPNI were not investigated in previous studies. Due to the wide range of diagnoses, patients enrolled in the study were divided into medical and surgical groups with a higher prevalence of surgical patients.
The results of our analysis demonstrate that higher plasma endotoxin, zonulin, IL-6, and hs-CRP levels are associated with progressively lower OPNI in medical-surgical ICU patients. These associations remained significant after adjusting for potential confounders (age and APACHE II). Moreover, our results indicated that this association was more identifiable in surgical ICU patients. These observations underscore the importance of nutritional condition in the recovery of systemic inflammation and intestinal barrier function [21]. The difference in the association of intestinal permeability and OPNI score between the surgical group and the medical group might be due to small sample size or might indicate that OPNI is a more appropriate indicator for assessing nutritional status in surgical patients. Therefore, we recommend that future studies with larger sample sizes be performed in both medical and surgical groups.
Studies have demonstrated that the OPNI predicts mortality, morbidity, and prognosis in several diseases including nonsurgical conditions [11,22-25]. However, OPNI has rarely been applied in the ICU setting [26]. Similar to a previous study conducted by Vermeulen et al. [26], the mean OPNI in our study was lower than the reference value [11]. In our previous study of critically ill patients, we found a significant positive association between intestinal permeability markers and high scores for nutritional risk [27]. Consistent with our results, Kang et al. [24] reported that, in peritoneal dialysis patients, OPNI and serum albumin were negatively correlated with CRP. Furthermore, Yenibertiz et al. [15] showed that CRP was significantly higher in a low OPNI group of patients with small‐cell lung cancer. Higher hs-CRP, lower OPNI, and older age are significant predictive factors for mortality among patients with total colectomy [28]. Milan Manani et al. [29] reported that IL-6 was negatively correlated with serum albumin in peritoneal dialysis patients. Decreased rate of albumin synthesis in critically ill patients results in hypoalbuminemia, which is often caused by combined effects of inflammation and malnutrition. Inflammation alone increases the fractional catabolic rate and alters the distribution of albumin between the intra- and extravascular compartments [30].
Two common complications seen in critically ill patients admitted to the ICU are increased systemic inflammation and intestinal permeability [7,8]. The leaky gut hypothesis explains that gut microbial products can cause chronic low-grade inflammation due to intestinal barrier dysfunction [31]. Infections or any trauma of the epithelial lining can severely damage intestinal barrier function, disrupting tissue homeostasis. Alteration of the gut barrier can lead to increased intestinal permeability, alter mucus composition and the intestinal layer, secretion of intestinal proteases, and damage to intestinal cells [32]. In addition, metabolic stress can induce secretion of pro-inflammatory cytokines and reactive oxygen species in intestinal epithelium.
Proinflammatory responses occur simultaneously with anti-inflammatory responses to maintain immunological balance; this condition is called compensatory anti-inflammatory response syndrome. During this state, the immune systems of critically ill patients reprogram their defense strategies and are often unable to eliminate the primary infection, often resulting in secondary infection [32]. Nutrition in critically ill patients admitted to the ICU deteriorates rapidly regardless of nutritional status at the time of admission [33]. Severe catabolism and the proinflammatory state due to increase in both hormones and cytokines can result in rapid loss of protein. This phenomenon differentiates critically ill patients from other types of hospitalized patients among whom malnutrition is mostly related to decreased food intake due to the disease state. Thus, it is important to observe the current metabolic states of critically ill patients during nutrition assessment even when admitted in a well-nourished state [34].
Higher levels of systemic inflammation in the body, structure, and function of intact mucous membrane and leakage of toxins such as bacterial endotoxins are highly associated with malnutrition [21]. In addition, malnutrition reduces the ratio of CD4+ to CD8+ T cells as well as the appearance of peripheral immature T cells [35]. Low levels of lymphocyte types (CD19) indicate some nutritional deficiencies [36]. Therefore, the relationship between circulating lymphocyte counts and malnutrition has been shown to be crucial in identifying nutrient deficiencies.
The strengths of this study are the analysis of blood samples analyzed at a central laboratory and data collected by standardized procedures. The OPNI is a well-validated and simple tool that can be calculated using only two parameters and applied to a large number of patients in critical care settings. As for the limitations of this study, the highly heterogeneous group of patients poses interpretive challenges. Therefore, to confirm the results of this study, further investigations should focus on specific populations. Clinical status and the use of medications in critically ill patients can alter albumin level and total lymphocyte count and make them difficult to interpret. Therefore, these parameters were determined over the first 24 hours after admission at the ICU. Another limitation is that longitudinal associations of IL-6, hs-CRP, endotoxin, and zonulin levels with OPNI cannot be detected due to the cross-sectional study design. The possibility that residual confounding factors explain the associations of IL-6, hs-CRP, endotoxin, and zonulin levels with OPNI cannot be excluded. Another limitation of this study is that we did not calculate sample size based on the medical and surgical groups. Further investigation involving a more accurate lymphocyte count or subset is necessary.
In conclusion, higher plasma endotoxin, zonulin, IL-6, and hs-CRP levels are significantly negatively associated with OPNI in a mixed ICU population, particularly in surgical ICU patients. According to our findings, screening critically ill patients using the OPNI that can indicate systemic inflammation and intestinal permeability was suggested. Patients with lower OPNI benefit more from nutritional interventions compared to those with higher OPNI.
KEY MESSAGES
▪ Elevated plasma levels of zonulin and endotoxin are related with lower Onodera’s prognostic nutritional index (OPNI), particularly in surgical intensive care unit patients.
▪ Higher serum interleukin-6 and high-sensitivity C-reactive protein levels are associated with lower OPNI.
NOTES
-
CONFLICT OF INTEREST No potential conflict of interest relevant to this article was reported.
-
AUTHOR CONTRIBUTIONS
Conceptualization: SHA, GE. Data curation: SHA. Formal analysis: SHA, GE. Funding acquisition: SHA, GE. Methodology: all authors. Project administration: GE. Visualization: SM. Writing–original draft: all authors. Writing–review & editing: SHA, SM.
Acknowledgments
The authors would like to thank the patients who participated in this study and the ICU personnel for their assistance. Indeed, without their collaboration the study would not have been possible.
This study is financially supported by Shahid Beheshti University of Medical Sciences, Tehran, Iran (grant no. 1395/74351).
Figure 1.Flowchart describing selection of participants. ICU: intensive care unit.

Table 1.Baseline demographic and clinical characteristics of the overall population according to OPNI class
|
Variable |
Overall (n=162) |
OPNI class
|
|
Low (≤40, n=102) |
High (>40, (n=60) |
P-value |
|
Age (yr) |
65 (49–75) |
69.5 (51–79) |
58 (49–70) |
0.002a,b
|
|
Sex |
|
|
|
0.088a,c
|
|
Male |
87 (53.7) |
60 (59) |
27 (45) |
|
|
Female |
75 (46.3) |
42 (41) |
33 (55) |
|
|
Hospital to ICU admission (day) |
0.5 (0–1) |
0 (0–1) |
1 (0–1) |
0.242b
|
|
Admission category |
|
|
|
0.021a,c
|
|
Medical |
78 (48) |
42 (41) |
36 (60) |
|
|
Surgical |
84 (52) |
60 (59) |
24 (40) |
|
|
Number of comorbidities |
0 (0–2) |
1 (0–2) |
0 (0–1) |
0.043a,b
|
|
Mechanical ventilation |
34 (21) |
20 (20) |
14 (23) |
0.574c
|
|
APACHE II score |
26 (21–36) |
25 (20–35) |
28 (21–40) |
0.066b
|
|
SOFA score |
8 (7–11) |
8 (7-11) |
9 (6-11) |
0.519b
|
|
OPNI score |
32.2 (24.5–45.3) |
27.5 (21.3–31.8) |
46.9 (43.9–51.5) |
<0.001a,b
|
|
Total lymphocyte count |
1,513 (890–2,386) |
1,163 (688–1,546) |
2,533 (2,024–2,899) |
<0.001a,b
|
|
Serum albumin (g/dl) |
2.5 (2–3.4) |
2 (1.7–2.4) |
3.5 (3.3–3.9) |
<0.001a,b
|
|
Serum IL-6 (pg/ml) |
222 (77–454) |
318 (96–477) |
157 (43–422) |
<0.001a,b
|
|
Serum hs-CRP |
4.01 (2.98–4.52) |
4.28 (3.77–4.60) |
2.30 (1.56–3.58) |
0.006a,b
|
|
Plasma zonulin (ng/ml) |
6.8 (4.3–11.5) |
8.2 (5.0–12.1) |
6.0 (3.5–9.5) |
0.022a,b
|
|
Plasma endotoxin (EU/mL) |
0.57 (0.33–0.86) |
0.66 (0.40–0.88) |
0.48 (0.31–0.78) |
0.034a,b
|
Table 2.Binary logistic regression to predict the associations of intestinal permeability/inflammation factors with OPNI in the overall population and stratified by admission category
|
Variable |
Overall (n=162)
|
Admission category
|
Medical (n=78)
|
Surgical (n=84)
|
|
OR (95% CI) |
P-value |
OR (95% CI) |
P-value |
OR (95% CI) |
P-valuea
|
|
Plasma zonulin |
|
|
|
|
|
|
|
First model |
0.75 (0.69–0.89) |
0.023 |
0.79 (0.75–0.98) |
0.049 |
0.71 (0.60–0.80) |
0.015 |
|
Second modelb
|
0.83 (0.75–0.98) |
0.048 |
0.91 (0.89–1.21) |
0.114 |
0.81 (0.78–0.96) |
0.044 |
|
Plasma endotoxin |
|
|
|
|
|
|
|
First model |
0.73 (0.69–0.81) |
0.021 |
0.80 (0.71–0.90) |
0.032 |
0.73 (0.69–0.89) |
0.032 |
|
Second modelb
|
0.81 (0.72–0.93) |
0.039 |
0.84 (0.80–1.09) |
0.069 |
0.79 (0.75–0.89) |
0.043 |
|
Serum IL-6 |
|
|
|
|
|
|
|
First model |
0.80 (0.70–0.90) |
0.039 |
0.91 (0.88–1.11) |
0.192 |
0.76 (0.75–0.80) |
0.034 |
|
Second modelb
|
0.88 (0.64–0.96) |
0.042 |
0.92 (0.82–1.23) |
0.236 |
0.80 (0.60–0.88) |
0.038 |
|
Serum hs-CRP |
|
|
|
|
|
|
|
First model |
0.74 (0.60–0.86) |
0.031 |
0.78 (0.58–0.88) |
0.040 |
0.65 (0.47–0.73) |
0.012 |
|
Second modelb
|
0.77 (0.53–0.92) |
0.025 |
0.79 (0.59–0.98) |
0.048 |
0.68 (0.52–0.77) |
0.014 |
References
- 1. Osooli F, Abbas S, Farsaei S, Adibi P. Identifying critically ill patients at risk of malnutrition and underfeeding: a prospective study at an academic hospital. Adv Pharm Bull 2019;9:314-20.ArticlePubMedPMC
- 2. McWhirter JP, Pennington CR. Incidence and recognition of malnutrition in hospital. BMJ 1994;308:945-8.ArticlePubMedPMC
- 3. Kubrak C, Jensen L. Malnutrition in acute care patients: a narrative review. Int J Nurs Stud 2007;44:1036-54.ArticlePubMed
- 4. Verity S. Nutrition and its importance to intensive care patients. Intensive Crit Care Nurs 1996;12:71-8.ArticlePubMed
- 5. Sertaridou E, Papaioannou V, Kolios G, Pneumatikos I. Gut failure in critical care: old school versus new school. Ann Gastroenterol 2015;28:309-22.PubMedPMC
- 6. Hoffer LJ, Bistrian BR. Nutrition in critical illness: a current conundrum. F1000Res 2016;5:2531. ArticlePubMedPMC
- 7. Preiser JC, Ichai C, Orban JC, Groeneveld AB. Metabolic response to the stress of critical illness. Br J Anaesth 2014;113:945-54.ArticlePubMed
- 8. MacFie J, O'Boyle C, Mitchell CJ, Buckley PM, Johnstone D, Sudworth P. Gut origin of sepsis: a prospective study investigating associations between bacterial translocation, gastric microflora, and septic morbidity. Gut 1999;45:223-8.ArticlePubMedPMC
- 9. Prins A. Nutritional assessment of the critically ill patient. South Afr J Clin Nutr 2010;23:11-8.Article
- 10. Manzanares W, Langlois PL, Wischmeyer PE. Restoring the microbiome in critically ill patients: are probiotics our true friends when we are seriously ill? JPEN J Parenter Enteral Nutr 2017;41:530-3.ArticlePubMed
- 11. Onodera T, Goseki N, Kosaki G. Prognostic nutritional index in gastrointestinal surgery of malnourished cancer patients. Nihon Geka Gakkai Zasshi 1984;85:1001-5.PubMed
- 12. Jian-Hui C, Iskandar EA, Cai ShI, Chen CQ, Wu H, Xu JB, et al. Significance of Onodera's prognostic nutritional index in patients with colorectal cancer: a large cohort study in a single Chinese institution. Tumour Biol 2016;37:3277-83.ArticlePubMed
- 13. Matsumoto H, Okamoto Y, Kawai A, Ueno D, Kubota H, Murakami H, et al. Prognosis prediction for postoperative esophageal cancer patients using Onodera's prognostic nutritional index. Nutr Cancer 2017;69:849-54.ArticlePubMed
- 14. Broggi MS, Patil D, Baum Y, Nieh PT, Alemozaffar M, Pattaras JG, et al. Onodera's prognostic nutritional index as an independent prognostic factor in clear cell renal cell carcinoma. Urology 2016;96:99-105.ArticlePubMed
- 15. Yenibertiz D, Ozyurek BA, Erdogan Y. Is Onodera's prognostic nutritional index (OPNI) a prognostic factor in small cell lung cancer (SCLC)? Clin Respir J 2020;Mar 14; [Epub]. https://doi.org/10.1111/crj.13185.Article
- 16. Chan AW, Chan SL, Wong GL, Wong VW, Chong CC, Lai PB, et al. Prognostic nutritional index (PNI) predicts tumor recurrence of very early/early stage hepatocellular carcinoma after surgical resection. Ann Surg Oncol 2015;22:4138-48.ArticlePubMed
- 17. Hong S, Zhou T, Fang W, Xue C, Hu Z, Qin T, et al. The prognostic nutritional index (PNI) predicts overall survival of small-cell lung cancer patients. Tumour Biol 2015;36:3389-97.ArticlePubMed
- 18. Knaus WA, Draper EA, Wagner DP, Zimmerman JE. APACHE II: a severity of disease classification system. Crit Care Med 1985;13:818-29.ArticlePubMed
- 19. Vincent JL, Moreno R, Takala J, Willatts S, De Mendonça A, Bruining H, et al. The SOFA (Sepsis-related Organ Failure Assessment) score to describe organ dysfunction/failure. On behalf of the Working Group on Sepsis-Related Problems of the European Society of Intensive Care Medicine. Intensive Care Med 1996;22:707-10.ArticlePubMed
- 20. American College of Chest Physicians/Society of Critical Care Medicine Consensus Conference: definitions for sepsis and organ failure and guidelines for the use of innovative therapies in sepsis. Crit Care Med 1992;20:864-74.PubMed
- 21. Bengmark S. Nutrition of the critically ill —: a 21st-century perspective. Nutrients 2013;5:162-207.ArticlePubMedPMC
- 22. Tokunaga R, Sakamoto Y, Nakagawa S, Miyamoto Y, Yoshida N, Oki E, et al. Prognostic nutritional index predicts severe complications, recurrence, and poor prognosis in patients with colorectal cancer undergoing primary tumor resection. Dis Colon Rectum 2015;58:1048-57.ArticlePubMed
- 23. Borda F, Miranda C, Borda A, Echeverría E, Guerra A, Iñigo JJ, et al. Relation between preoperative prognostic Onodera's index and postsurgery complications in the R0 gastric carcinoma resection. An Sist Sanit Navar 2017;40:67-75.ArticlePubMed
- 24. Kang SH, Cho KH, Park JW, Yoon KW, Do JY. Onodera's prognostic nutritional index as a risk factor for mortality in peritoneal dialysis patients. J Korean Med Sci 2012;27:1354-8.ArticlePubMedPMC
- 25. Sachlova M, Majek O, Tucek S. Prognostic value of scores based on malnutrition or systemic inflammatory response in patients with metastatic or recurrent gastric cancer. Nutr Cancer 2014;66:1362-70.ArticlePubMed
- 26. Vermeulen KM, Leal LL, Furtado MC, Vale SH, Lais LL. Phase angle and Onodera's prognostic nutritional index in critically ill patients. Nutr Hosp 2016;33:1268-75.ArticlePubMed
- 27. Eslamian G, Ardehali SH, Vahdat Shariatpanahi Z. Association of intestinal permeability with a NUTRIC score in critically ill patients. Nutrition 2019;63-64:1-8.ArticlePubMed
- 28. Chohno T, Uchino M, Sasaki H, Bando T, Takesue Y, Ikeuchi H. Associations between the prognostic nutritional index and morbidity/mortality during intestinal resection in patients with ulcerative colitis. World J Surg 2018;42:1949-59.ArticlePubMed
- 29. Milan Manani S, Virzì GM, Clementi A, Brocca A, de Cal M, Tantillo I, et al. Pro-inflammatory cytokines: a possible relationship with dialytic adequacy and serum albumin in peritoneal dialysis patients. Clin Kidney J 2016;9:153-7.ArticlePubMed
- 30. Don BR, Kaysen G. Serum albumin: relationship to inflammation and nutrition. Semin Dial 2004;17:432-7.PubMed
- 31. Fukui H. Increased intestinal permeability and decreased barrier function: does it really influence the risk of inflammation? Inflamm Intest Dis 2016;1:135-45.ArticlePubMedPMC
- 32. Haussner F, Chakraborty S, Halbgebauer R, Huber-Lang M. Challenge to the intestinal mucosa during sepsis. Front Immunol 2019;10:891. ArticlePubMedPMC
- 33. Mukhopadhyay A, Henry J, Ong V, Leong CS, Teh AL, van Dam RM, et al. Association of modified NUTRIC score with 28-day mortality in critically ill patients. Clin Nutr 2017;36:1143-8.ArticlePubMed
- 34. Kondrup J. Nutritional-risk scoring systems in the intensive care unit. Curr Opin Clin Nutr Metab Care 2014;17:177-82.ArticlePubMed
- 35. Schaible UE, Kaufmann SH. Malnutrition and infection: complex mechanisms and global impacts. PLoS Med 2007;4:e115.ArticlePubMedPMC
- 36. Grzegorzewska AE, Leander M. Total lymphocyte count and subpopulation lymphocyte counts in relation to dietary intake and nutritional status of peritoneal dialysis patients. Adv Perit Dial 2005;21:35-40.PubMed
Citations
Citations to this article as recorded by

- Association of malnutrition status with 30-day mortality in patients with sepsis using objective nutritional indices: a multicenter retrospective study
Moon Seong Baek, Young Suk Kwon, Sang Soo Kang, Daechul Shim, Youngsang Yoon, Jong Ho Kim
Acute and Critical Care.2024; 39(1): 127. CrossRef - Practical parameters that can be used for nutritional assessment in patients hospitalized in the intensive care unit with the diagnosis of chronic obstructive pulmonary disease
Ramazan Baldemir, Mustafa Özgür Cirik
Medicine.2022; 101(24): e29433. CrossRef - Nutritional Status, Body Composition, and Inflammation Profile in Older Patients with Advanced Chronic Kidney Disease Stage 4–5: A Case-Control Study
Mar Ruperto, Guillermina Barril
Nutrients.2022; 14(17): 3650. CrossRef

 , Ghazaleh Eslamian2


 PubReader
 ePub Link
 Cite
Cite