
Articles
- Page Path
- HOME > Acute Crit Care > Volume 33(3); 2018 > Article
- Original Article Changes in the Characteristics and Long-term Mortality Rates of Intensive Care Unit Patients from 2003 to 2010: A Nationwide Population-Based Cohort Study Performed in the Republic of Korea
-
Jeongwon Heo1
 , Yoonki Hong2, Seon-Sook Han2, Woo Jin Kim2, Jae-Woo Kwon2,3, Ki Won Moon2, Jae Hoon Jeong4, Young-Ju Kim4, Seung-Hwan Lee5, Seung-Joon Lee2
 -
Acute and Critical Care 2018;33(3):135-145.
DOI: https://doi.org/10.4266/acc.2018.00164
Published online: August 31, 2018
1Department of Internal Medicine, Kangwon National University Hospital, Chuncheon, Korea
2Department of Internal Medicine, Kangwon National University School of Medicine, Chuncheon, Korea
3Division of Allergy and Clinical Immunology, Kangwon National University School of Medicine, Chuncheon, Korea
4Department of Statistics, Kangwon National University, Chuncheon, Korea
5Department of Neurology, Kangwon National University School of Medicine, Chuncheon, Korea
- Corresponding author Seung-Joon Lee Department of Internal Medicine, Kangwon National University School of Medicine, 1 Gangwondaehak-gil, Chuncheon 24341, Korea Tel: +82-33-258-9365 Fax: +82-33-255-6567 E-mail: medfman@gmail.com
Copyright © 2018 The Korean Society of Critical Care Medicine
This is an Open Access article distributed under the terms of the Creative Commons Attribution Non-Commercial License (http://creativecommons.org/licenses/by-nc/4.0/) which permits unrestricted non-commercial use, distribution, and reproduction in any medium, provided the original work is properly cited.
Abstract
-
Background
- There are few studies on intensive care unit (ICU) patients in the Republic of Korea. We analyzed the characteristics and mortality changes of all ICU patients over the last 8 years.
-
Methods
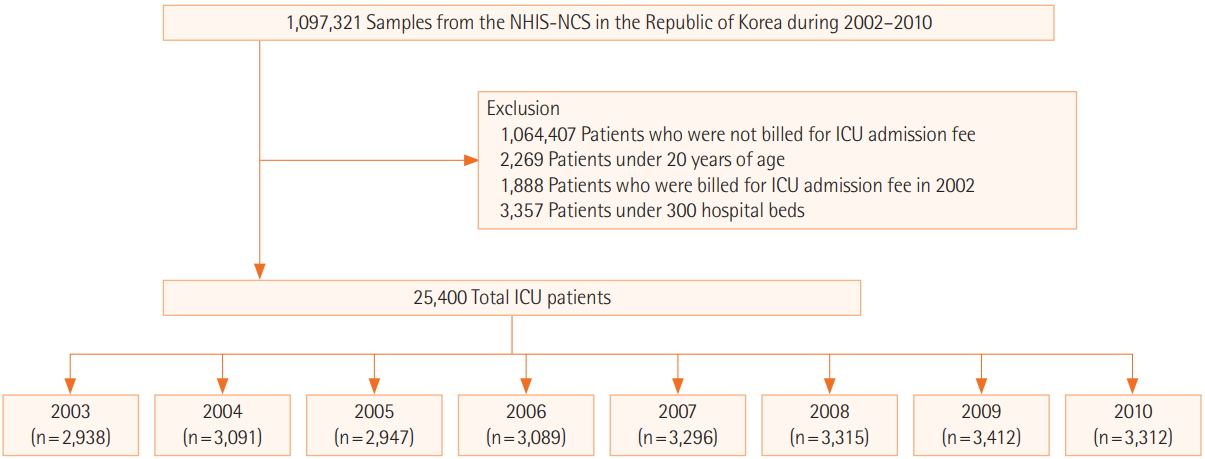
- This study used the cohort of the National Health Insurance Corporation, which provides medical care to all residents of the Republic of Korea. The cohort consists of patients aged 20 years or older between 2003 and 2010 with a history of ICU admission. We analyzed changes in sex, age, household income, number of hospital beds, emergency admissions, and reasons for admission using the Cochran–Armitage trend test. The adjusted hazard ratios (HRs) of mortality according to these variables and year of admission were calculated by Cox proportional hazards regression.
-
Results
- The proportion of patients aged ≥70 years increased over that period, as did their average age (by 3.6 years). During the 8-year study period, the 3-year mortality rate was 32.91%–35.83%. The overall mortality was higher in males and older patients, in those with a lower household income and higher Charlson Comorbidity Index (CCI) score, those admitted to a hospital with a smaller number of beds, and those admitted via the emergency room. There was no significant change in crude mortality rate over the 8-year study period; however, the adjusted HR showed a decreasing trend.
-
Conclusions
- Patients admitted to the ICU were older and had higher CCI score. Nevertheless, there was a temporal trend toward a decrease in the HR of long-term mortality.
INTRODUCTION
MATERIALS AND METHODS
RESULTS
DISCUSSION
KEY MESSAGES
Acknowledgments
SUPPLEMENTARY MATERIALS
| Variable | Total | 2003 | 2004 | 2005 | 2006 | 2007 | 2008 | 2009 | 2010 | β (P-value)a |
|---|---|---|---|---|---|---|---|---|---|---|
| Total of ICU admission | 25,400 (2.31) | 2,938 (0.29) | 3,091 (0.30) | 2,947 (0.29) | 3,089 (0.31) | 3,296 (0.32) | 3,315 (0.33) | 3,412 (0.34) | 3,312 (0.33) | 0.007 (0.001) |
| Sex | ||||||||||
| Male | 14,721 (57.96) | 1,607 (54.7) | 1,753 (56.71) | 1,769 (60.03) | 1,805 (58.43) | 1,965 (59.62) | 1,949 (58.79) | 1,952 (57.21) | 1,921 (58.00) | 0.27 (0.337) |
| Female | 10,679 (42.04) | 1,331 (45.3) | 1,338 (43.29) | 1,178 (39.97) | 1,284 (41.57) | 1,331 (40.38) | 1,366 (41.21) | 1,460 (42.79) | 1,391 (42.00) | -0.27 (0.337) |
| Age (yr) | ||||||||||
| 20-29 | 787 (3.10) | 121 (4.12) | 125 (4.04) | 87 (2.95) | 90 (2.91) | 94 (2.85) | 112 (3.38) | 91 (2.67) | 67 (2.02) | -0.24 (0.008) |
| 30-39 | 1,565 (6.16) | 232 (7.90) | 254 (8.22) | 207 (7.02) | 172 (5.57) | 191 (5.79) | 169 (5.10) | 157 (4.60) | 183 (5.53) | -0.47 (0.003) |
| 40-49 | 3,286 (12.94) | 421 (14.33) | 470 (15.21) | 416 (14.12) | 383 (12.40) | 417 (12.65) | 398 (12.01) | 408 (11.96) | 373 (11.26) | -0.52 (0.001) |
| 50-59 | 4,607 (18.14) | 550 (18.72) | 545 (17.63) | 507 (17.20) | 560 (18.13) | 583 (17.69) | 617 (18.61) | 632 (18.52) | 613 (18.51) | 0.08 (0.390) |
| 60-69 | 6,275 (24.70) | 757 (25.77) | 795 (25.72) | 763 (25.89) | 791 (25.61) | 795 (24.12) | 789 (23.80) | 782 (22.92) | 803 (24.25) | -0.38 (0.009) |
| 70-79 | 5,952 (23.43) | 605 (20.59) | 616 (19.93) | 645 (21.89) | 728 (23.57) | 810 (24.58) | 824 (24.86) | 902 (26.44) | 822 (24.82) | 0.85 (0.001) |
| ≥80 | 2,928 (11.53) | 252 (8.58) | 286 (9.25) | 322 (10.93) | 365 (11.82) | 406 (12.32) | 406 (12.25) | 440 (12.90) | 451 (13.62) | 0.69 (0.001) |
| Age (yr), mean±SD | 62.15±15.37 | 60.02±15.58 | 59.95±15.76 | 61.54±15.42 | 62.59±15.13 | 62.74±15.32 | 62.79±15.34 | 63.53±15.03 | 63.63±14.92 | 0.56 (0.001) |
| Household income | ||||||||||
| High | 7,740 (30.47) | 904 (30.77) | 948 (30.67) | 852 (28.91) | 942 (30.50) | 977 (29.64) | 999 (30.14) | 1,075 (31.51) | 1,043 (31.49) | 0.14 (0.329) |
| Middle | 9,674 (38.09) | 1,113 (37.88) | 1,243 (40.21) | 1,139 (38.65) | 1,208 (39.11) | 1,272 (38.59) | 1,256 (37.89) | 1,237 (36.25) | 1,206 (36.41) | -0.39 (0.043) |
| Low | 7,986 (31.44) | 921 (31.35) | 900 (29.12) | 956 (32.44) | 939 (30.40) | 1,047 (31.77) | 1,060 (31.98) | 1,100 (32.24) | 1,063 (32.10) | 0.24 (0.169) |
| CCI | ||||||||||
| 0 | 3,961 (15.59) | 550 (18.72) | 593 (19.18) | 462 (15.68) | 454 (14.70) | 474 (14.38) | 480 (14.48) | 483 (14.16) | 465 (14.04) | -0.73 (0.005) |
| 1 | 6,901 (27.17) | 802 (27.30) | 924 (29.89) | 855 (29.01) | 864 (27.97) | 880 (26.70) | 880 (26.55) | 870 (25.50) | 826 (24.94) | -0.56 (0.013) |
| 2 | 4,934 (19.43) | 545 (18.55) | 535 (17.31) | 563 (19.10) | 603 (19.52) | 691 (20.96) | 634 (19.13) | 676 (19.81) | 687 (20.74) | 0.34 (0.040) |
| ≥3 | 9,604 (37.81) | 1,041 (35.43) | 1,039 (33.61) | 1,067 (36.21) | 1,168 (37.81) | 1,251 (37.96) | 1,321 (39.85) | 1,383 (40.53) | 1,334 (40.28) | 0.95 (0.001) |
| Comorbidity | ||||||||||
| Myocardial infarction | 1,825 (7.19) | 212 (7.22) | 220 (7.12) | 218 (7.40) | 267 (8.64) | 241 (7.31) | 247 (7.45) | 221 (6.48) | 199 (6.01) | -0.15 (0.226) |
| Congestive heart failure | 860 (3.39) | 128 (4.36) | 94 (3.04) | 102 (3.46) | 121 (3.92) | 114 (3.46) | 98 (2.96) | 106 (3.11) | 97 (2.93) | -0.13 (0.072) |
| Peripheral vascular | 449 (1.77) | 53 (1.80) | 58 (1.88) | 58 (1.97) | 46 (1.49) | 67 (2.03) | 53 (1.60) | 67 (1.96) | 47 (1.42) | 0.03 (0.393) |
| Cerebrovascular | 4,349 (17.12) | 489 (16.64) | 513 (16.6) | 567 (19.24) | 529 (17.13) | 553 (16.78) | 540 (16.29) | 544 (15.94) | 614 (18.54) | 0.01 (0.961) |
| Dementia | 90 (0.35) | 4 (0.14) | 0 | 5 (0.17) | 18 (0.58) | 13 (0.39) | 8 (0.24) | 23 (0.67) | 19 (0.57) | 0.07 (0.027) |
| Chronic pulmonary | 919 (3.62) | 109 (3.71) | 123 (3.98) | 103 (3.50) | 117 (3.79) | 140 (4.25) | 111 (3.35) | 111 (3.25) | 105 (3.17) | -0.08 (0.135) |
| Rheumatology | 45 (0.18) | 5 (0.17) | 12 (0.39) | 3 (0.10) | 5 (0.16) | 3 (0.09) | 7 (0.21) | 5 (0.15) | 5 (0.15) | -0.01 (0.416) |
| Peptic ulcer | 835 (3.29) | 112 (3.81) | 103 (3.33) | 104 (3.53) | 106 (3.43) | 94 (2.85) | 124 (3.74) | 103 (3.02) | 89 (2.69) | -0.11 (0.072) |
| Mild liver | 972 (3.83) | 136 (4.63) | 125 (4.04) | 124 (4.21) | 113 (3.66) | 124 (3.76) | 134 (4.04) | 107 (3.14) | 109 (3.29) | -0.17 (0.007) |
| Diabetes without chronic complications | 909 (3.58) | 78 (2.65) | 75 (2.43) | 78 (2.65) | 79 (2.56) | 155 (4.70) | 143 (4.31) | 145 (4.25) | 156 (4.71) | 0.36 (0.001) |
| Diabetes with chronic complications | 352 (1.39) | 42 (1.43) | 36 (1.16) | 37 (1.26) | 47 (1.52) | 60 (1.82) | 53 (1.60) | 45 (1.32) | 32 (0.97) | -0.01 (0.776) |
| Hemiplegia or paraplegia | 344 (1.35) | 36 (1.23) | 41 (1.33) | 37 (1.26) | 55 (1.78) | 45 (1.37) | 48 (1.45) | 34 (1.00) | 48 (1.45) | 0.00 (0.987) |
| Renal | 490 (1.93) | 65 (2.21) | 55 (1.78) | 55 (1.87) | 58 (1.88) | 57 (1.73) | 77 (2.32) | 65 (1.91) | 58 (1.75) | -0.01 (0.663) |
| Any malignancy, including leukemia and lymphoma | 3,803 (14.97) | 453 (15.42) | 461 (14.91) | 402 (13.64) | 473 (15.31) | 475 (14.41) | 484 (14.60) | 537 (15.74) | 518 (15.64) | 0.09 (0.450) |
| Moderate or severe liver | 434 (1.71) | 67 (2.28) | 63 (2.04) | 53 (1.80) | 47 (1.52) | 48 (1.46) | 53 (1.60) | 50 (1.47) | 53 (1.60) | -0.09 (0.014) |
| Metastasis solid tumor | 938 (3.69) | 149 (5.07) | 125 (4.04) | 105 (3.56) | 111 (3.59) | 127 (3.85) | 96 (2.90) | 118 (3.46) | 107 (3.23) | -0.20 (0.021) |
| AIDS/HIV | 7 (0.03) | 0 | 1 (0.03) | 1 (0.03) | 1 (0.03) | 1 (0.03) | 0 | 2 (0.06) | 1 (0.03) | 0.003 (0.313) |
| Hospital bed | ||||||||||
| >803 | 14,777 (58.18) | 1,883 (64.09) | 2,012 (65.09) | 1,683 (57.11) | 1,811 (58.63) | 1,807 (54.82) | 1,821 (54.93) | 1,930 (56.57) | 1,830 (55.25) | -1.36 (0.012) |
| 500-803 | 7,223 (28.44) | 752 (25.60) | 761 (24.62) | 835 (28.33) | 867 (28.07) | 1,013 (30.73) | 1,003 (30.26) | 986 (28.90) | 1,006 (30.37) | 0.75 (0.012) |
| 300-499 | 3,400 (13.39) | 303 (10.31) | 318 (10.29) | 429 (14.56) | 411 (13.31) | 476 (14.44) | 491 (14.81) | 496 (14.54) | 476 (14.37) | 0.61 (0.021) |
| Emergency admission | ||||||||||
| Emergency room | 13,466 (53.02) | 1,329 (45.23) | 1,354 (43.80) | 1,603 (54.39) | 1,684 (54.52) | 1,838 (55.76) | 1,871 (56.44) | 1,921 (56.30) | 1,866 (56.34) | 1.75 (0.011) |
| Others | 11,934 (46.98) | 1,609 (54.77) | 1,737 (56.20) | 1,344 (45.61) | 1,405 (45.48) | 1,458 (44.24) | 1,444 (43.56) | 1,491 (43.70) | 1,446 (43.66) | -1.75 (0.011) |
| Admission reason | ||||||||||
| Cardiovascular | 10,820 (42.60) | 1,182 (40.23) | 1,268 (41.02) | 1,292 (43.84) | 1,371 (44.38) | 1,413 (42.87) | 1,409 (42.50) | 1,449 (42.47) | 1,436 (43.36) | 0.28 (0.211) |
| Cancer | 4,608 (18.14) | 548 (18.65) | 540 (17.47) | 482 (16.36) | 568 (18.39) | 581 (17.63) | 594 (17.92) | 656 (19.23) | 639 (19.29) | 0.20 (0.196) |
| Trauma/poisoning | 2,736 (10.77) | 289 (9.84) | 277 (8.96) | 324 (10.99) | 317 (10.26) | 394 (11.95) | 384 (11.58) | 372 (10.90) | 379 (11.44) | 0.29 (0.047) |
| Gastrointestinal/liver | 2,656 (10.46) | 351 (11.95) | 376 (12.16) | 317 (10.76) | 332 (10.75) | 323 (9.80) | 345 (10.41) | 320 (9.38) | 292 (8.82) | -0.45 (0.001) |
| Respiratory | 1,807 (7.11) | 193 (6.57) | 235 (7.60) | 208 (7.06) | 218 (7.06) | 268 (8.13) | 222 (6.70) | 253 (7.42) | 210 (6.34) | -0.03 (0.768) |
| Infectious | 1,039 (4.09) | 126 (4.29) | 131 (4.24) | 136 (4.61) | 106 (3.43) | 110 (3.34) | 141 (4.25) | 148 (4.34) | 141 (4.26) | -0.01 (0.894) |
| Endocrinology | 616 (2.43) | 91 (3.10) | 90 (2.91) | 67 (2.27) | 66 (2.14) | 82 (2.49) | 77 (2.32) | 77 (2.26) | 66 (1.99) | -0.12 (0.016) |
| Others | 1,118 (4.40) | 158 (5.38) | 174 (5.63) | 121 (4.11) | 111 (3.59) | 125 (3.79) | 143 (4.31) | 137 (4.02) | 149 (4.50) | -0.15 (0.172) |
Values are presented as the number of ICU patients (%) unless otherwise indicated.
ICU: intensive care unit; SD: standard deviation; CCI: Charlson Comorbidity Index; AIDS/HIV: acquired immune deficiency syndrome and human immunodeficiency virus infection.
a β: the slope parameter estimate of a simple linear regression of the proportion of each category on year; the P-value for the hypothesis β=0.
| Admission year |
Mortality (%) |
||
|---|---|---|---|
| 90-Day | 1-Year | 3-Year | |
| 2003 | 491 (16.71) | 726 (24.71) | 971 (33.05) |
| 2004 | 547 (17.70) | 767 (24.81) | 1,038 (33.58) |
| 2005 | 558 (18.93) | 782 (26.54) | 1,056 (35.83) |
| 2006 | 555 (17.97) | 798 (25.83) | 1,073 (34.74) |
| 2007 | 555 (16.84) | 807 (24.48) | 1,090 (33.07) |
| 2008 | 604 (18.22) | 838 (25.28) | 1,127 (34.00) |
| 2009 | 613 (17.97) | 837 (24.53) | 1,123 (32.91) |
| 2010 | 617 (18.63) | 818 (24.70) | 1,093 (33.00) |
| P-valuea | 0.098 | 0.245 | 0.149 |
| Variable |
Mortality (%) |
|||||
|---|---|---|---|---|---|---|
| 90-Day | P-valuea | 1-Year | P-valuea | 3-Year | P-valuea | |
| Total | 4,540 (17.87) | 6,373 (25.09) | 8,571 (33.74) | |||
| Sex | 0.2226 | 0.0027 | 0.0001 | |||
| Male | 2,668 (18.12) | 3,796 (25.79) | 5,137 (34.90) | |||
| Female | 1,872 (17.53) | 2,577 (24.13) | 3,434 (32.16) | |||
| Age (yr) | 0.0001 | 0.0001 | 0.0001 | |||
| 20-29 | 52 (6.61) | 62 (7.88) | 78 (9.91) | |||
| 30-39 | 150 (9.58) | 187 (11.95) | 238 (15.21) | |||
| 40-49 | 379 (11.53) | 485 (14.76) | 637 (19.39) | |||
| 50-59 | 589 (12.78) | 790 (17.15) | 1,075 (23.33) | |||
| 60-69 | 926 (14.76) | 1,381 (22.01) | 1,923 (30.65) | |||
| 70-79 | 1,385 (23.27) | 1,983 (33.32) | 2,690 (45.19) | |||
| ≥80 | 1,059 (36.17) | 1,485 (50.72) | 1,930 (65.92) | |||
| Household income | 0.0022 | 0.0001 | 0.0001 | |||
| High | 1,407 (18.18) | 2,002 (25.87) | 2,689 (34.74) | |||
| Middle | 1,630 (16.85) | 2,272 (23.49) | 3,105 (32.10) | |||
| Low | 1,503 (18.82) | 2,099 (26.28) | 2,777 (34.77) | |||
| CCI | 0.0001 | 0.0001 | 0.0001 | |||
| 0 | 440 (11.11) | 550 (13.89) | 692 (17.47) | |||
| 1 | 992 (14.37) | 1,359 (19.69) | 1,780 (25.79) | |||
| 2 | 817 (16.56) | 1,128 (22.86) | 1,575 (31.92) | |||
| ≥3 | 2,291 (23.85) | 3,336 (34.74) | 4,524 (47.11) | |||
| Hospital bed | 0.0001 | 0.0001 | 0.0001 | |||
| >803 | 2,385 (16.14) | 3,371 (22.81) | 4,603 (31.15) | |||
| 500-803 | 1,410 (19.52) | 1,950 (27.00) | 2,612 (36.16) | |||
| 300-499 | 745 (21.91) | 1,052 (30.94) | 1,356 (39.88) | |||
| Emergency admission | 0.0001 | 0.0001 | 0.0001 | |||
| Emergency room | 2,893 (21.48) | 3,959 (29.40) | 5,110 (37.95) | |||
| Others | 1,647 (13.80) | 2,414 (20.23) | 3,461 (29.00) | |||
| Admission reason | 0.0001 | 0.0001 | 0.0001 | |||
| Respiratory | 616 (34.09) | 812 (44.94) | 1,007 (55.73) | |||
| Infectious | 378 (36.38) | 451 (43.41) | 505 (48.60) | |||
| Cancer | 1,084 (23.52) | 1,631 (35.39) | 2,261 (49.07) | |||
| Endocrinology | 90 (14.61) | 145 (23.54) | 218 (35.39) | |||
| Gastrointestinal/liver | 380 (14.31) | 524 (19.73) | 755 (28.43) | |||
| Cardiovascular | 1,542 (14.25) | 2,197 (20.30) | 2,973 (27.48) | |||
| Trauma/poisoning | 363 (13.27) | 491 (17.95) | 680 (24.85) | |||
| Others | 87 (7.78) | 122 (10.91) | 172 (15.38) | |||
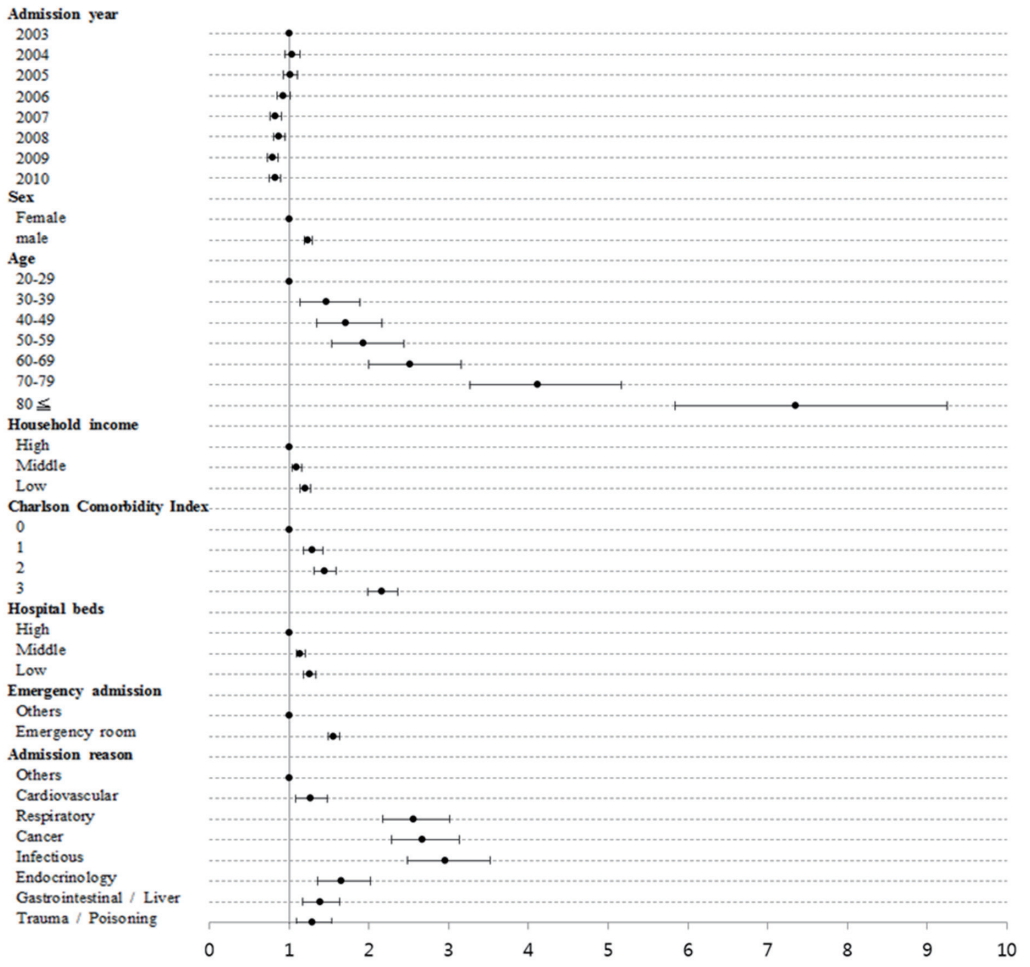
| Variable |
Adjusteda HR (95% CI) |
||
|---|---|---|---|
| 90-Day mortality | 1-Year mortality | 3-Year mortality | |
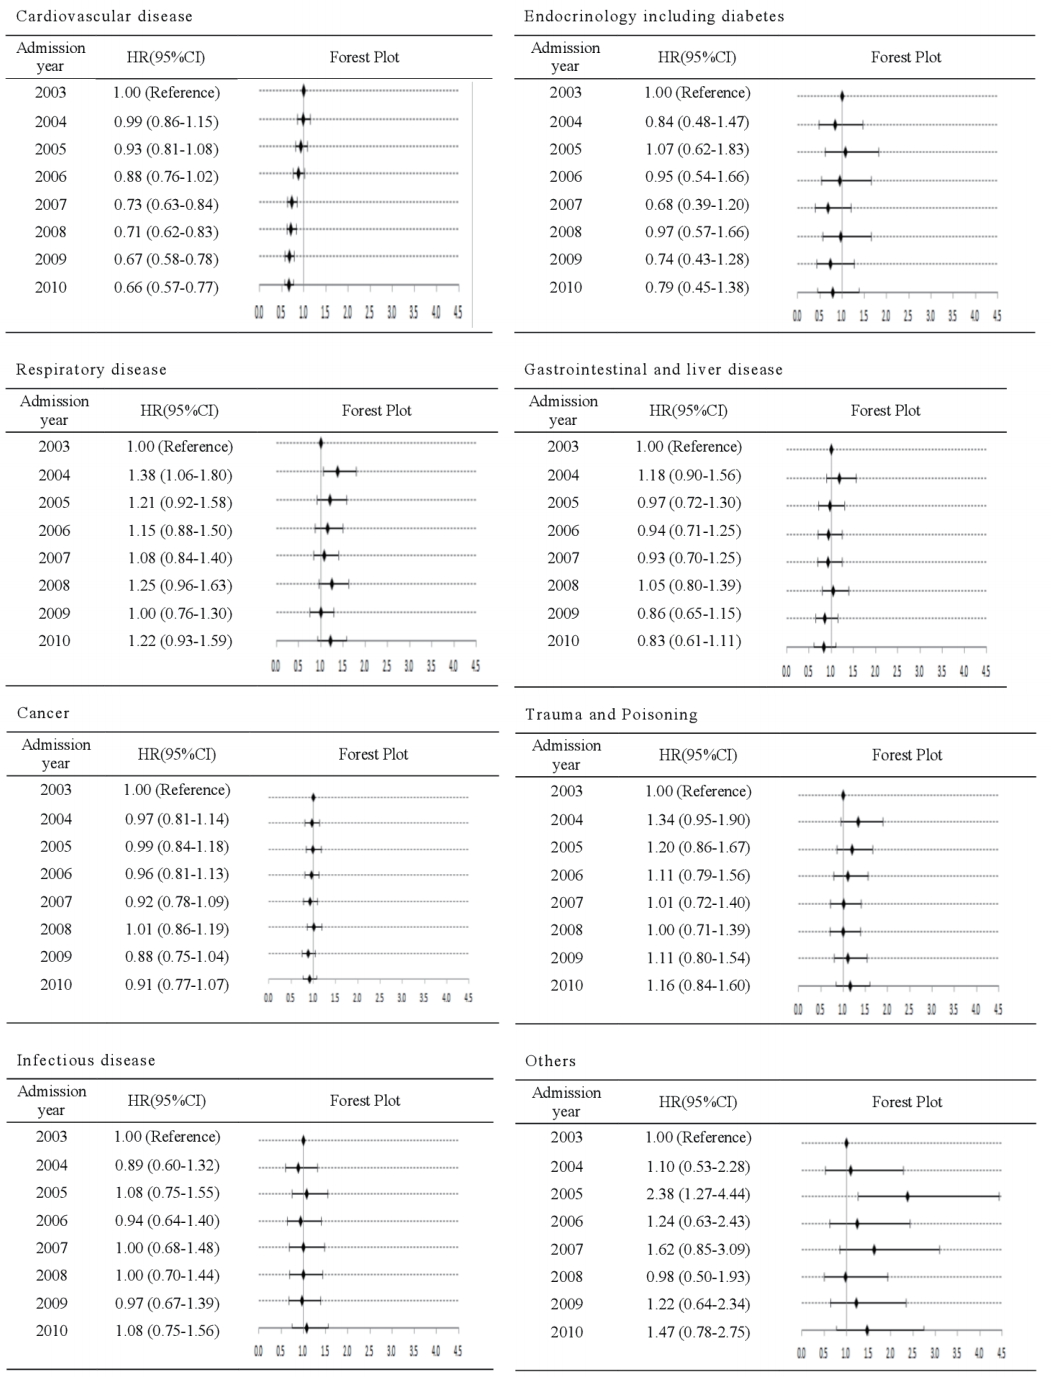
| Admission year | |||
| 2003 | 1.00 (Reference) | 1.00 (Reference) | 1.00 (Reference) |
| 2004 | 1.07 (0.95-1.21) | 1.02 (0.92-1.13) | 1.04 (0.95-1.14) |
| 2005 | 1.04 (0.92-1.17) | 0.99 (0.89-1.09) | 1.01 (0.93-1.10) |
| 2006 | 0.95 (0.84-1.07) | 0.92 (0.83-1.01) | 0.93 (0.85-1.01) |
| 2007 | 0.85 (0.76-0.96) | 0.83 (0.75-0.92) | 0.83 (0.76-0.91) |
| 2008 | 0.94 (0.83-1.05) | 0.87 (0.79-0.96) | 0.88 (0.80-0.95) |
| 2009 | 0.88 (0.78-0.99) | 0.80 (0.72-0.88) | 0.79 (0.73-0.86) |
| 2010 | 0.94 (0.83-1.06) | 0.83 (0.75-0.92) | 0.82 (0.76-0.90) |
| Sex | |||
| Female | 1.00 (Reference) | 1.00 (Reference) | 1.00 (Reference) |
| Male | 1.14 (1.07-1.21) | 1.20 (1.14-1.26) | 1.24 (1.19-1.30) |
| Age (yr) | |||
| 20-29 | 1.00 (Reference) | 1.00 (Reference) | 1.00 (Reference) |
| 30-39 | 1.40 (1.02-1.92) | 1.45 (1.09-1.94) | 1.47 (1.13-1.89) |
| 40-49 | 1.59 (1.18-2.12) | 1.66 (1.27-2.16) | 1.71 (1.35-2.17) |
| 50-59 | 1.65 (1.24-2.20) | 1.80 (1.39-2.34) | 1.93 (1.53-2.44) |
| 60-69 | 1.84 (1.38-2.44) | 2.24 (1.73-2.90) | 2.51 (2.00-3.16) |
| 70-79 | 2.92 (2.20-3.87) | 3.58 (2.77-4.63) | 4.11 (3.27-5.17) |
| ≥80 | 4.73 (3.56-6.28) | 6.13 (4.74-7.94) | 7.35 (5.84-9.25) |
| Household income | |||
| High | 1.00 (Reference) | 1.00 (Reference) | 1.00 (Reference) |
| Middle | 1.08 (1.01-1.17) | 1.07 (1.01-1.14) | 1.10 (1.04-1.15) |
| Low | 1.20 (1.11-1.29) | 1.20 (1.13-1.28) | 1.20 (1.14-1.27) |
| CCI | |||
| 0 | 1.00 (Reference) | 1.00 (Reference) | 1.00 (Reference) |
| 1 | 1.17 (1.04-1.31) | 1.24 (1.12-1.37) | 1.30 (1.18-1.42) |
| 2 | 1.23 (1.09-1.40) | 1.30 (1.17-1.44) | 1.45 (1.32-1.59) |
| ≥3 | 1.76 (1.58-1.97) | 1.96 (1.78-2.16) | 2.16 (1.98-2.36) |
| Hospital bed | |||
| >803 | 1.00 (Reference) | 1.00 (Reference) | 1.00 (Reference) |
| 500-803 | 1.17 (1.09-1.25) | 1.16 (1.09-1.22) | 1.14 (1.09-1.20) |
| 300-499 | 1.26 (1.16-1.37) | 1.30 (1.21-1.39) | 1.25 (1.18-1.33) |
| Emergency admissi | n | ||
| Others | 1.00 (Reference) | 1.00 (Reference) | 1.00 (Reference) |
| Emergency room | 1.71 (1.60-1.82) | 1.67 (1.58-1.76) | 1.56 (1.49-1.63) |
| Admission reason | |||
| Others | 1.00 (Reference) | 1.00 (Reference) | 1.00 (Reference) |
| Cardiovascular | 1.33 (1.07-1.65) | 1.32 (1.10-1.58) | 1.27 (1.09-1.48) |
| Respiratory | 2.81 (2.24-3.53) | 2.69 (2.22-3.26) | 2.56 (2.17-3.01) |
| Cancer | 2.43 (1.94-3.03) | 2.62 (2.17-3.16) | 2.68 (2.29-3.13) |
| Infectious | 3.89 (3.07-4.91) | 3.47 (2.84-4.25) | 2.96 (2.49-3.52) |
| Endocrinology | 1.33 (0.99-1.79) | 1.50 (1.18-1.91) | 1.66 (1.35-2.02) |
| Gastrointestinal/liver | 1.38 (1.09-1.74) | 1.34 (1.10-1.63) | 1.39 (1.17-1.64) |
| Trauma/poisoning | 1.33 (1.05-1.68) | 1.28 (1.05-1.56) | 1.30 (1.10-1.53) |
- 1. Bagshaw SM, Webb SA, Delaney A, George C, Pilcher D, Hart GK, et al. Very old patients admitted to intensive care in Australia and New Zealand: a multi-centre cohort analysis. Crit Care 2009;13:R45. ArticlePubMedPMC
- 2. Kontis V, Bennett JE, Mathers CD, Li G, Foreman K, Ezzati M. Future life expectancy in 35 industrialised countries: projections with a Bayesian model ensemble. Lancet 2017;389:1323-35.ArticlePubMedPMC
- 3. Milbrandt EB, Kersten A, Rahim MT, Dremsizov TT, Clermont G, Cooper LM, et al. Growth of intensive care unit resource use and its estimated cost in Medicare. Crit Care Med 2008;36:2504-10.ArticlePubMed
- 4. Molina JA, Seow E, Heng BH, Chong WF, Ho B. Outcomes of direct and indirect medical intensive care unit admissions from the emergency department of an acute care hospital: a retrospective cohort study. BMJ Open 2014;4:e005553. ArticlePubMedPMC
- 5. Halpern NA, Pastores SM. Critical care medicine in the United States 2000-2005: an analysis of bed numbers, occupancy rates, payer mix, and costs. Crit Care Med 2010;38:65-71.ArticlePubMed
- 6. Halpern NA, Pastores SM, Greenstein RJ. Critical care medicine in the United States 1985-2000: an analysis of bed numbers, use, and costs. Crit Care Med 2004;32:1254-9.ArticlePubMed
- 7. Wallace DJ, Angus DC, Seymour CW, Barnato AE, Kahn JM. Critical care bed growth in the United States: a comparison of regional and national trends. Am J Respir Crit Care Med 2015;191:410-6.ArticlePubMedPMC
- 8. Lee J, Lee JS, Park SH, Shin SA, Kim K. Cohort profile: The National Health Insurance Service-National Sample Cohort (NHISNSC), South Korea. Int J Epidemiol 2017;46:e15. ArticlePubMedPDF
- 9. Kaukonen KM, Bailey M, Suzuki S, Pilcher D, Bellomo R. Mortality related to severe sepsis and septic shock among critically ill patients in Australia and New Zealand, 2000-2012. JAMA 2014;311:1308-16.ArticlePubMed
- 10. Zimmerman JE, Kramer AA, Knaus WA. Changes in hospital mortality for United States intensive care unit admissions from 1988 to 2012. Crit Care 2013;17:R81. ArticlePubMedPMC
- 11. Mahmood K, Eldeirawi K, Wahidi MM. Association of gender with outcomes in critically ill patients. Crit Care 2012;16:R92. ArticlePubMedPMC
- 12. Fuchs L, Chronaki CE, Park S, Novack V, Baumfeld Y, Scott D, et al. ICU admission characteristics and mortality rates among elderly and very elderly patients. Intensive Care Med 2012;38:1654-61.ArticlePubMedPMC
- 13. Schnegelsberg A, Mackenhauer J, Nibro HL, Dreyer P, Koch K, Kirkegaard H. Impact of socioeconomic status on mortality and unplanned readmission in septic intensive care unit patients. Acta Anaesthesiol Scand 2016;60:465-75.ArticlePubMed
- 14. Christensen S, Johansen MB, Christiansen CF, Jensen R, Lemeshow S. Comparison of Charlson comorbidity index with SAPS and APACHE scores for prediction of mortality following intensive care. Clin Epidemiol 2011;3:203-11.ArticlePubMedPMC
- 15. Charlson ME, Pompei P, Ales KL, MacKenzie CR. A new method of classifying prognostic comorbidity in longitudinal studies: development and validation. J Chronic Dis 1987;40:373-83.ArticlePubMed
- 16. Sjoding MW, Prescott HC, Wunsch H, Iwashyna TJ, Cooke CR. Longitudinal changes in ICU admissions among elderly patients in the United States. Crit Care Med 2016;44:1353-60.ArticlePubMedPMC
- 17. Koch K, Nørgaard M, Schønheyder HC, Thomsen RW, Søgaard M, Danish Collaborative Bacteremia Network. Effect of socioeconomic status on mortality after bacteremia in workingage patients: a Danish population-based cohort study. PLoS One 2013;8:e70082.ArticlePubMedPMC
- 18. Hutchings A, Raine R, Brady A, Wildman M, Rowan K. Socioeconomic status and outcome from intensive care in England and Wales. Med Care 2004;42:943-51.ArticlePubMed
- 19. Le Gall JR, Lemeshow S, Saulnier F. A new Simplified Acute Physiology Score (SAPS II) based on a European/North American multicenter study. JAMA 1993;270:2957-63.ArticlePubMed
- 20. Knaus WA, Draper EA, Wagner DP, Zimmerman JE. APACHE II: a severity of disease classification system. Crit Care Med 1985;13:818-29.ArticlePubMed
- 21. Lemeshow S, Teres D, Klar J, Avrunin JS, Gehlbach SH, Rapoport J. Mortality Probability Models (MPM II) based on an international cohort of intensive care unit patients. JAMA 1993;270:2478-86.ArticlePubMed
- 22. Ho KM, Knuiman M, Finn J, Webb SA. Estimating long-term survival of critically ill patients: the PREDICT model. PLoS One 2008;3:e3226.ArticlePubMedPMC
- 23. Johnston JA, Wagner DP, Timmons S, Welsh D, Tsevat J, Render ML. Impact of different measures of comorbid disease on predicted mortality of intensive care unit patients. Med Care 2002;40:929-40.ArticlePubMed
- 24. Jhun HJ, Kim H, Cho SI. Time trend and age-period-cohort effects on acute myocardial infarction mortality in Korean adults from 1988 to 2007. J Korean Med Sci 2011;26:637-41.ArticlePubMedPMC
References
Figure & Data
References
Citations
- Three-year mortality, readmission, and medical expenses in critical care survivors: A population-based cohort study
Jiyeon Kang, Kwang Min Lee
Australian Critical Care.2024; 37(2): 251. CrossRef - Effects of Intensive Care Experience on Post-Intensive Care Syndrome among Critical Care Survivors : Partial Least Square-Structural Equation Modeling Approach
Young Shin Cho, Jiyeon Kang
Journal of Korean Critical Care Nursing.2024; 17(1): 30. CrossRef - Trends in Mortality after Intensive Care of Patients with Aneurysmal Subarachnoid Hemorrhage in Finland in 2003–2019: A Finnish Intensive Care Consortium study
Jyri J. Virta, Markus Skrifvars, Matti Reinikainen, Stepani Bendel, Ruut Laitio, Sanna Hoppu, Tero Ala-Kokko, Jari Siironen, Rahul Raj
Neurocritical Care.2022; 37(2): 447. CrossRef - Change in management and outcome of mechanical ventilation in Korea: a prospective observational study
Jae Kyeom Sim, Sang-Min Lee, Hyung Koo Kang, Kyung Chan Kim, Young Sam Kim, Yun Seong Kim, Won-Yeon Lee, Sunghoon Park, So Young Park, Ju-Hee Park, Yun Su Sim, Kwangha Lee, Yeon Joo Lee, Jin Hwa Lee, Heung Bum Lee, Chae-Man Lim, Won-Il Choi, Ji Young Hong
The Korean Journal of Internal Medicine.2022; 37(3): 618. CrossRef - Cardiac Dysfunction Is Not Associated with Increased Reintubation Rate in Patients Treated with Post-extubation High-Flow Nasal Cannula
Jae Kyeom Sim, Juwhan Choi, Jee Youn Oh, Kyung Hoon Min, Gyu Young Hur, Sung Yong Lee, Jae Jeong Shim, Young Seok Lee
Tuberculosis and Respiratory Diseases.2022; 85(4): 332. CrossRef - Characteristics and outcomes of patients admitted to adult intensive care units in Hong Kong: a population retrospective cohort study from 2008 to 2018
Lowell Ling, Chun Ming Ho, Pauline Yeung Ng, King Chung Kenny Chan, Hoi Ping Shum, Cheuk Yan Chan, Alwin Wai Tak Yeung, Wai Tat Wong, Shek Yin Au, Kit Hung Anne Leung, Jacky Ka Hing Chan, Chi Keung Ching, Oi Yan Tam, Hin Hung Tsang, Ting Liong, Kin Ip Law
Journal of Intensive Care.2021;[Epub] CrossRef - Neurointensive care results and risk factors for unfavorable outcome in aneurysmatic SAH: a comparison of two age groups
Vilja Välimäki, Teemu Luostarinen, Jarno Satopää, Rahul Raj, Jyri J. Virta
Acta Neurochirurgica.2021; 163(5): 1469. CrossRef - Long‐term trends in critical care admissions in Wales**
R. J. Pugh, R. Bailey, T. Szakmany, M. Al Sallakh, J. Hollinghurst, A. Akbari, R. Griffiths, C. Battle, C. Thorpe, C. P. Subbe, R. A. Lyons
Anaesthesia.2021; 76(10): 1316. CrossRef - Retrospective Analysis of Long-Term Survival in Very Elderly (age ≥80) Critically Ill Patients of a Medical Intensive Care Unit at a Tertiary Care Hospital in Korea
Seung Hun Lee, Ju-Young Kim, Tae Hoon Kim, Sun Mi Ju, Jung-Wan Yoo, Seung Jun Lee, Yu Ji Cho, Yi Yeong Jeong, Jong Deog Lee, Ho Cheol Kim
Tuberculosis and Respiratory Diseases.2020; 83(3): 242. CrossRef - Long-term mortality of patients discharged from the hospital after successful critical care in the ICU in Korea: a retrospective observational study in a single tertiary care teaching hospital
Se Hee Na, Cheung Soo Shin, Gwan Ho Kim, Jae Hoon Kim, Jong Seok Lee
Korean Journal of Anesthesiology.2020; 73(2): 129. CrossRef - Critical Care Research Using “Big Data”: A Reality in the Near Future
Kwangha Lee
Acute and Critical Care.2018; 33(4): 269. CrossRef
 PubReader
 ePub Link
 Cite
Cite


