Comparison of intracranial pressure prediction in hydrocephalus patients among linear, non-linear, and machine learning regression models in Thailand
Article information

Abstract
Background
Hydrocephalus (HCP) is one of the most significant concerns in neurosurgical patients because it can cause increased intracranial pressure (ICP), resulting in mortality and morbidity. To date, machine learning (ML) has been helpful in predicting continuous outcomes. The primary objective of the present study was to identify the factors correlated with ICP, while the secondary objective was to compare the predictive performances among linear, non-linear, and ML regression models for ICP prediction.
Methods
A total of 412 patients with various types of HCP who had undergone ventriculostomy was retrospectively included in the present study, and intraoperative ICP was recorded following ventricular catheter insertion. Several clinical factors and imaging parameters were analyzed for the relationship with ICP by linear correlation. The predictive performance of ICP was compared among linear, non-linear, and ML regression models.
Results
Optic nerve sheath diameter (ONSD) had a moderately positive correlation with ICP (r=0.530, P<0.001), while several ventricular indexes were not statistically significant in correlation with ICP. For prediction of ICP, random forest (RF) and extreme gradient boosting (XGBoost) algorithms had low mean absolute error and root mean square error values and high R2 values compared to linear and non-linear regression when the predictive model included ONSD and ventricular indexes.
Conclusions
The XGBoost and RF algorithms are advantageous for predicting preoperative ICP and establishing prognoses for HCP patients. Furthermore, ML-based prediction could be used as a non-invasive method.
INTRODUCTION
Hydrocephalus (HCP) is one of the major problems faced by neurosurgeons because not treating or delaying treatment for HCP can cause increased intracranial pressure (ICP) and brainstem injury, leading to mortality and disability [1,2]. Elevated ICP is associated with unfavorable outcomes and poor prognoses in neurosurgical patients [3,4]. Therefore, predicting ICP before cerebrospinal fluid diversion is important to evaluate patients’ prognoses and provide advice to their relatives.
Prior studies have examined the relationships between ICP and various imaging parameters, such as optic nerve sheath diameter (ONSD) and ventricular indexes, for ICP prediction by traditional statistical analysis; however, their results have been inconclusive [5-9]. Lee et al. [5] studied HCP in adult patients and found that ONSD was significantly and linearly correlated with ICP (r=0.543, P<0.001), while Kavi et al. [6] found no correlation between ONSD and ICP using the linear correlation test. Additionally, Jenjitranant et al. [7] found that ONSD factors were significantly associated with increased ICP by logistic regression analysis.
Ventricular indexes composed of the Evans index, third ventricular index, cella media index, and ventricular score have been studied for ICP-level association [8,9]. Kim et al. [8] studied patients with communicating, non-communicating, or normal pressure HCP and found that the third ventricular index had a negative correlation with ICP (r=−0.395, P<0.01) in non-communicating HCP, while Eide et al. identified a non-significant relationship between ventricular indexes and ICP [9].
Machine learning (ML) has been used to predict various clinical outcomes in various neurosurgical fields. Further, ML classification has been commonly used in studies to predict binary classifiers and categorical outcomes [10-13]. Miyagawa et al. [11] used ML classification to predict the suspected increase of ICP in children with HCP and reported an accuracy of 91%–94%, while Schweingruber et al. [12] predicted increased ICP in patients by recurrent ML classification and reported an accuracy of 0.686–0.931. According to our literature review, however, few studies have mentioned ML regression for ICP prediction, which could be a non-invasive approach in real-world practice. Based on this gap in knowledge, the primary purpose of the present study was to identify the factors correlated with ICP, and the secondary objective was to compare predictive performances among linear, non-linear, and ML regression models for ICP prediction.
MATERIALS AND METHODS
Study Design and Population
After gaining approval from the Ethics Committee and Institutional Review Board of the Faculty of Medicine at Prince of Songkla University (REC.65-249-10-1). Informed consent from the patients was not necessary for the present study, as it involved a retrospective analysis. However, patient identification numbers were encoded before analysis. Our retrospective cohort investigation began with a review of the electronic medical records of HCP patients who were admitted and underwent ventriculostomy at a tertiary hospital between January 2014 and June 2022. Clinical characteristics and imaging parameters were collected. Patients who did not undergo preoperative cranial computed tomography (CT) imaging or who had missing data on intraoperative ICP after ventriculostomy were excluded, as shown in Figure 1.
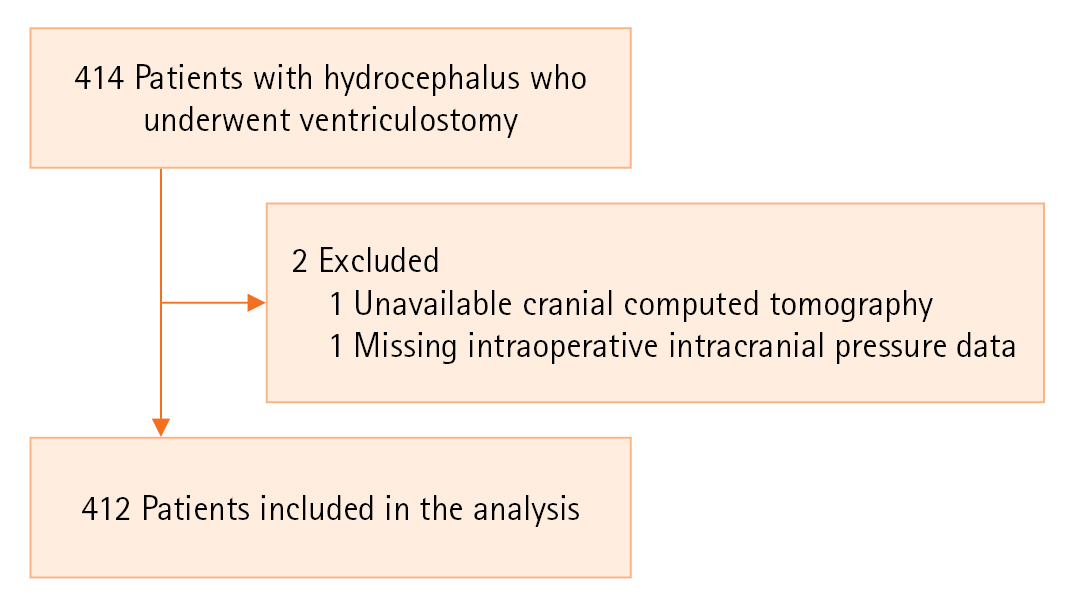
Patient flowchart for inclusion and analysis.
Operational Definition
ICP was the outcome of the present study and was intraoperatively measured after ventricular catheter insertion. Therefore, ICP in cm H2O was converted to mm Hg using the equation 1 cm H2O=0.736 mm Hg [13]. Several preoperative imaging parameters were also collected for hypothesis testing. According to a study by Mataró et al. [14], several ventricular lines were estimated for calculating the ventricular indexes, as shown in Figure 2A and B. In detail, the following various lines were measured from a cranial CT scan at the level of the third ventricle: the maximum bifrontal distance of the lateral ventricle (A), the distance between the caudate nuclei at the level of the foramen of Monro (B), the maximum width of the third ventricle (C), and the maximum inner diameter of the skull at the level of the maximum bifrontal distance measurement (E). Meanwhile, the minimum width of the cella media (D) and the maximal outer interparietal diameter (F) were measured at the level of the cella media. Subsequently, the ventricular indexes were calculated as follows:
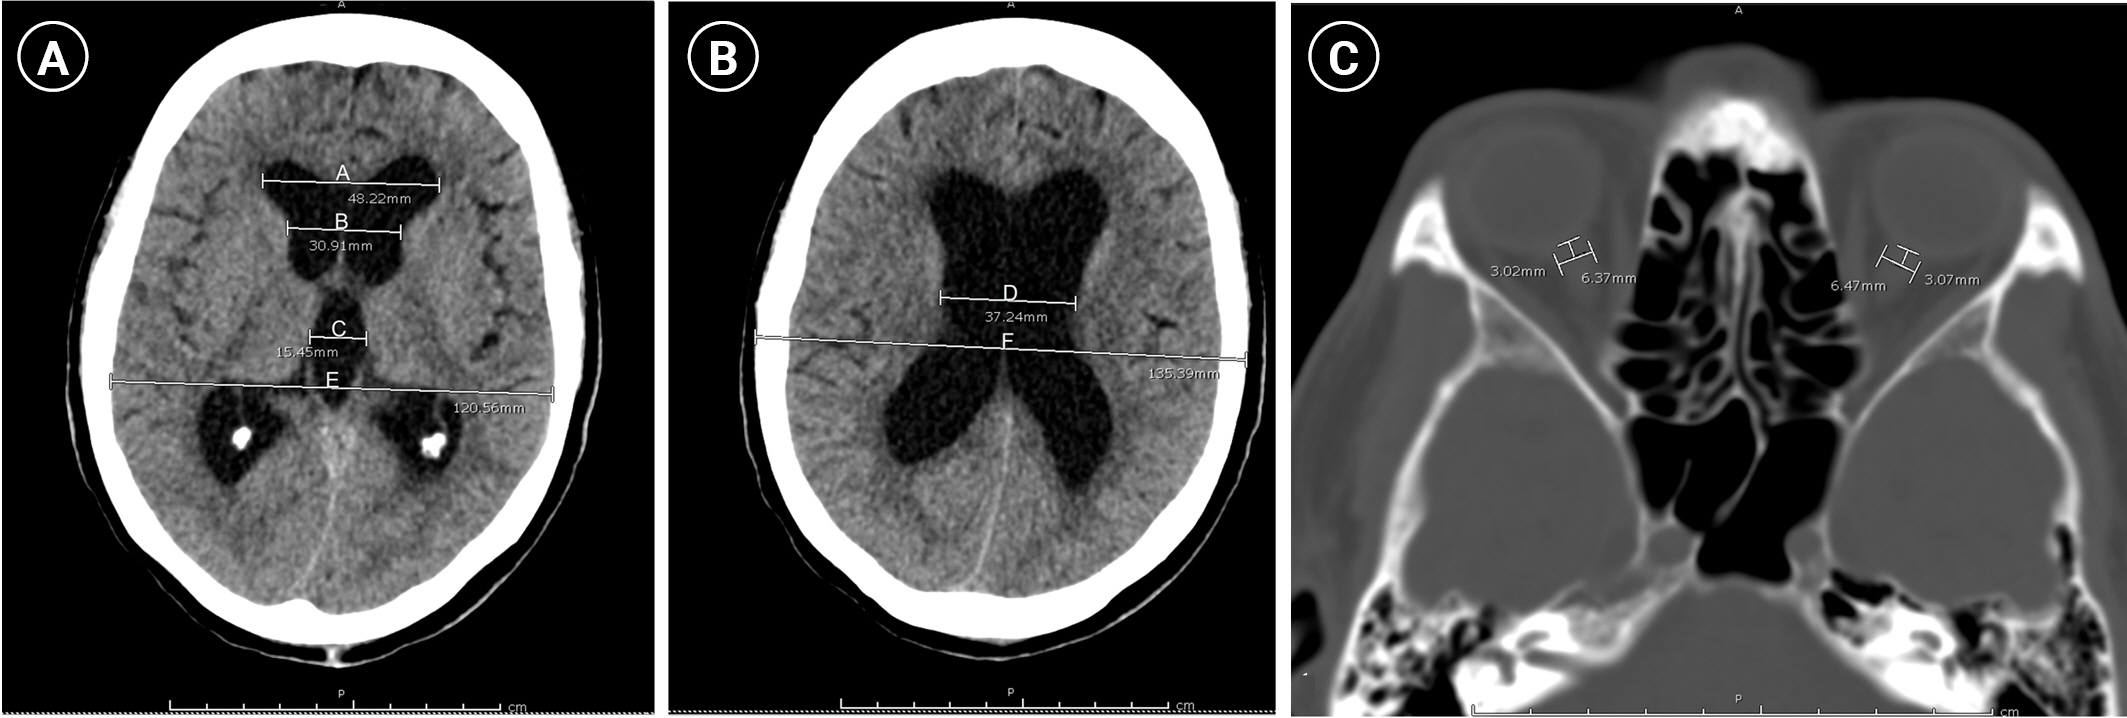
Measurement of ventricular parameters and optic nerve sheath diameters. (A) Ventricular parameters at the level of the foramen of Monro. (B) Ventricular parameters at the level of the cella media. (C) Optic nerve sheath diameter measurement.
Evans index (A/E), third ventricle index (C/E), cella media index (D/F), and ventricular score [(A+B+C+D)/E×100].
The ONSD of both eyes was measured on an axis perpendicular to the optic nerve (transverse plane) at 3 mm behind the globe by axial CT imaging according to the method of Jenjitranant et al. [7], as shown in Figure 2C. Therefore, the average ONSD was calculated for analysis.
Statistical Analysis
Using descriptive statistics, the baseline characteristics of the current cohort were outlined. In detail, the categorical variables are presented as percentage, whereas the continuous variables are presented as mean and standard deviation (SD). Pearson’s correlation was used to evaluate the strength of the association; values indicating a very weak correlation ranged from 0–0.19, those indicating a weak correlation ranged from 0.2–0.39, those indicating a moderate correlation ranged from 0.4–0.59, those indicating a strong correlation ranged from 0.6–0.79, and those indicating a very strong correlation ranged from 0.8–1.0 [15]. Moreover, the correlation matrix was used for visualization with the scatterplot among various variables.
The correlation coefficient formula was used to determine the sample size for hypothesis testing [16]. In a previous study [8], a correlation coefficient of 0.543, alpha value of 0.05, and beta value of 0.1 were employed for estimation. As a result, a sample size of at least 32 patients was required for validation.
ML Regression
A random 80:20 split was used to divide the whole set of data into a training dataset and a testing dataset, respectively. Of these, the training dataset was used to construct the predictive model, while the performance of ICP prediction was estimated using the testing dataset. Various traditional regression models were performed, including linear regression, polynomial regression, log transformation, and cubic spline regression, for ICP prediction. Additionally, the following algorithms of ML regression were used to develop the models: k-nearest neighbors, decision tree, random forest (RF), extreme gradient boosting (XGBoost), and artificial neural network. In detail, 10-fold cross-validation was performed for training, and the best tuning parameters for the model of each algorithm were optimized by minimizing the root mean square error (RMSE) according to the method of Kassambara [17].
The setting of the RF in the present study was 500 trees contained in the forest and 5 nodes of the terminal node size, whereas the architecture of the artificial neural network included 2 hidden layers with 3 and 2 neurons, respectively, and a single output.
Predictive Performance Metrics
The predictive performances of the linear, non-linear, and ML models were compared using the mean absolute error (MAE), RMSE, and R2. The best model should have the highest R2 and lowest errors. Therefore, the linear, non-linear, and ML regression models were performed using the “caret” package in R version 4.0.3 (R Foundation for Statistical Computing). In addition, the ML models were provided as web application by the shiny R package.
RESULTS
Four hundred twelve patients were included in the analysis. The baseline clinical characteristics are shown in Table 1. The mean age of patients was 51 years (SD, 24 years), and more than half were female. Additionally, emergency ventriculostomy was performed in 94.2%, and two-thirds of HCP cases were obstructive cases. Intraoperative ICP was recorded in the operative notes when a ventricular catheter was inserted. The mean ICP was 31.43 mm Hg (SD, 9.45 mm Hg), and 59.2% of patients had a Glasgow coma scale score less than 9 points.
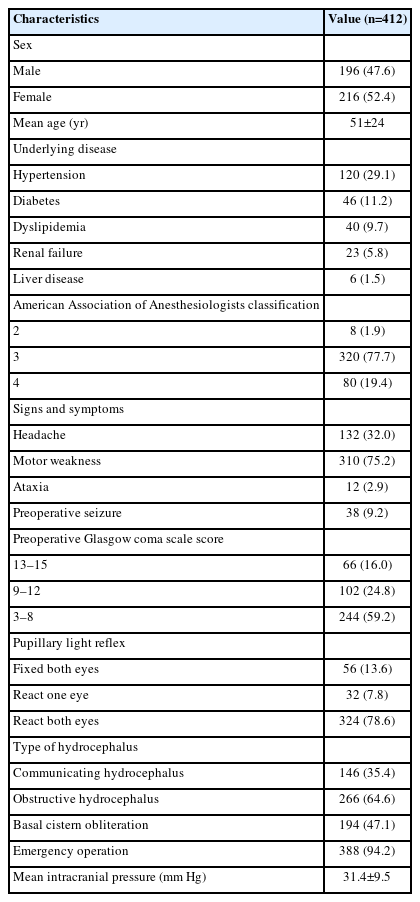
Baseline characteristics of the present cohort
The average imaging parameters are shown in Table 2. The mean ONSD was 5.5 mm (SD, 0. 8 mm), while the mean Evans index, mean third ventricular index, mean cella media index, and mean ventricular score were 0.3 (SD, 0.1), 0.1 (SD, 0.0), 0.3 (SD, 0.1), and 95.3 (SD, 23.7), respectively.
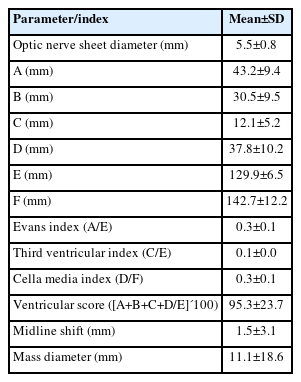
Average imaging parameters and indexes
Factors Correlated with ICP
The correlations between various parameters and ICP are demonstrated in Figure 3 using a correlation matrix. The ONSD had a moderately positive correlation with ICP (r=0.530, P<0.001) according to Pearson’s correlation, whereas no ventricular indexes were statistically correlated.
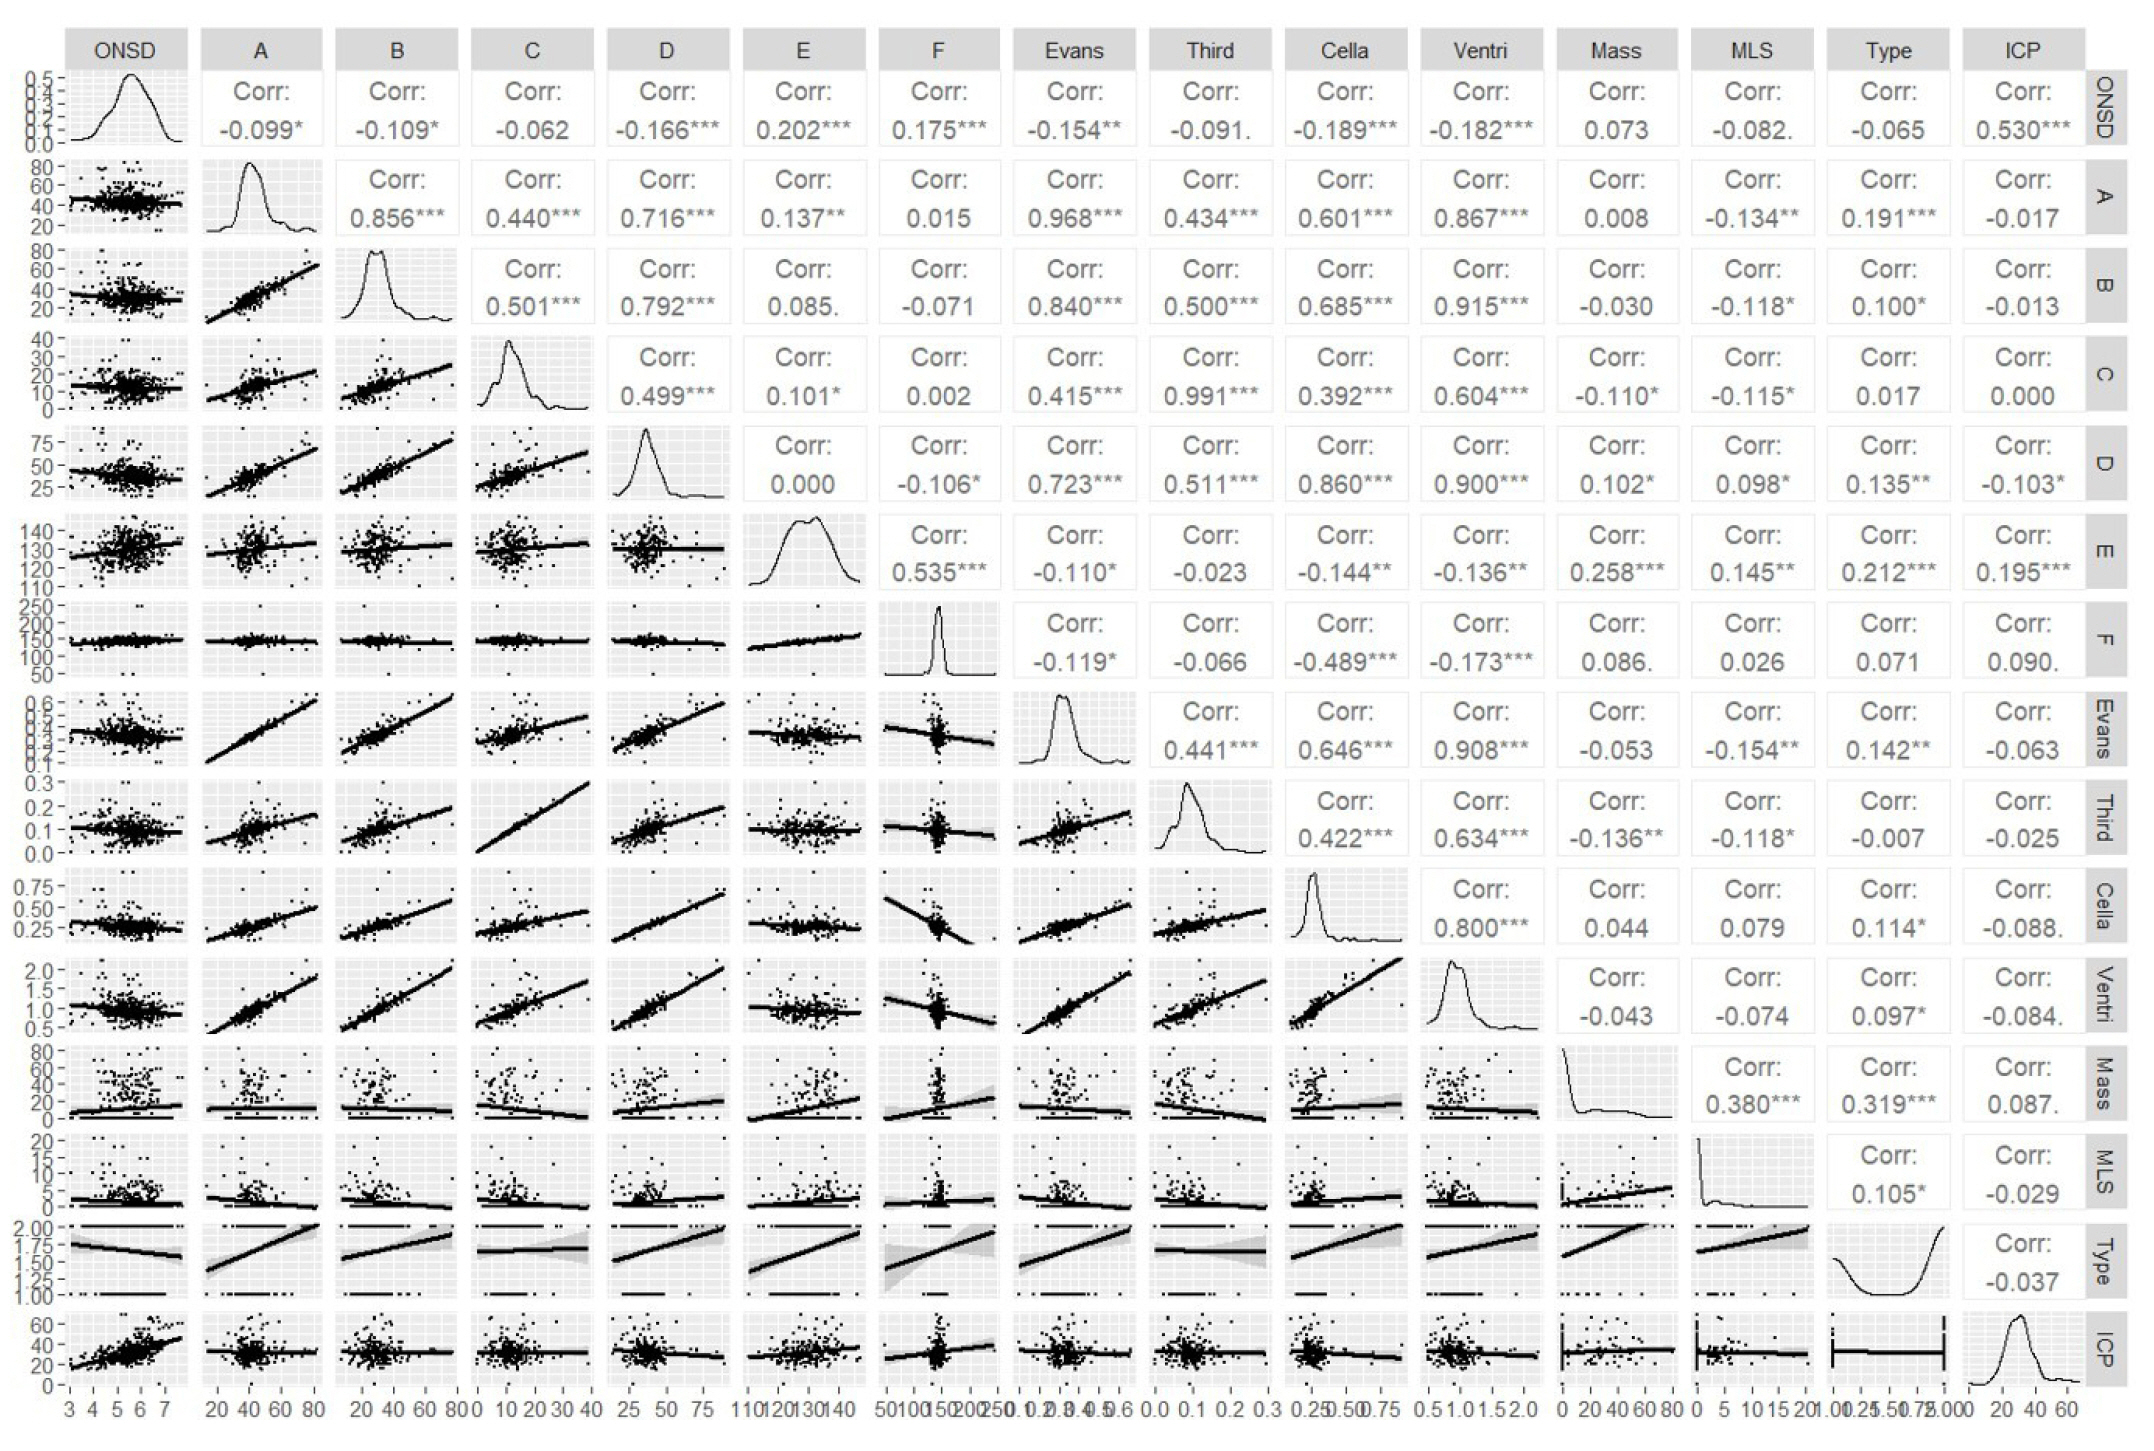
Correlation matrix of various parameters together with their scatterplots. ONSD: optic nerve sheath diameter; A: the maximum bifrontal distance of the lateral ventricle; B: the distance between the caudate nuclei at the level of the foramen of Monro; C: the maximum width of the third ventricle; D: the minimum width of both cella media; E: the maximum inner diameter of the skull at the level of the maximum bifrontal distance measurement; F: the maximal outer interparietal diameter; Ventri: ventricular score; Mass: mass diameter; MLS: midline shift; ICP: intracranial pressure.
Comparison of the Predictive Performance Metrics among Regression Models
After the 80:20 data split, 330 HCP patients were used to train the predictive model, while the remaining patients were used for testing performances. Although ONSD was a significant parameter related to ICP, ventricular indexes and other features were still necessary to build a predictive model and test their performances. Therefore, the following three strategies were adopted for model development and predictive performance evaluation: (1) ONSD; (2) ONSD with ventricular indexes; and (3) ONSD, ventricular indexes, and other features (mass diameters and midline shift). The predictive performances of various models for ICP are shown in Table 3.
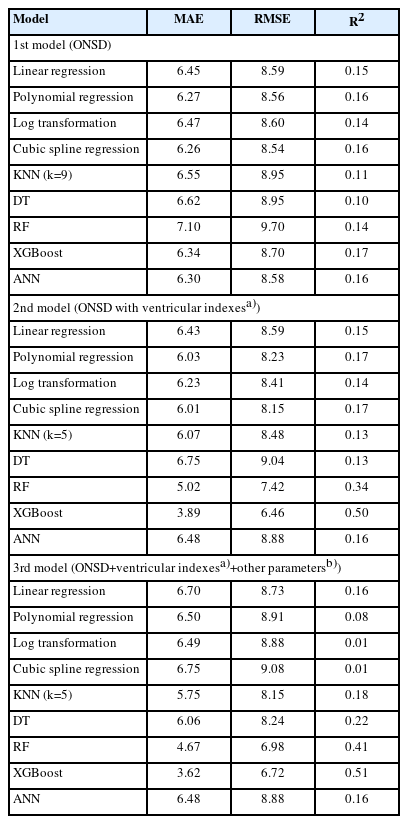
Predictive performances of various models for intracranial pressure
The cubic spline regression had the lowest MAE and RMSE in the first strategy of model development. However, low R2 values in all regression models were observed and ranged from 0.10–0.17. In the second strategy, the addition of ventricular indexes in the model increased R2 dramatically to 0.34 and 0.50 in RF and XGBoost algorithms, respectively. Moreover, the XGBoost regression had the lowest errors among the models. Model development with the third strategy revealed slightly increased predictive performances, with RF and XGBoost algorithms still exhibiting low errors and high R2 values. Compared to linear regression, Figure 4 shows the real and predicted ICP values calculated by RF and XGBoost algorithms. The ICP that was predicted by XGBoost was closer to the regression line than those of linear and RF regression. For general-practice implications, we enable access to the web application at https://neurosxpus.shinyapps.io/ICP_HCP/, as shown in Figure 5.
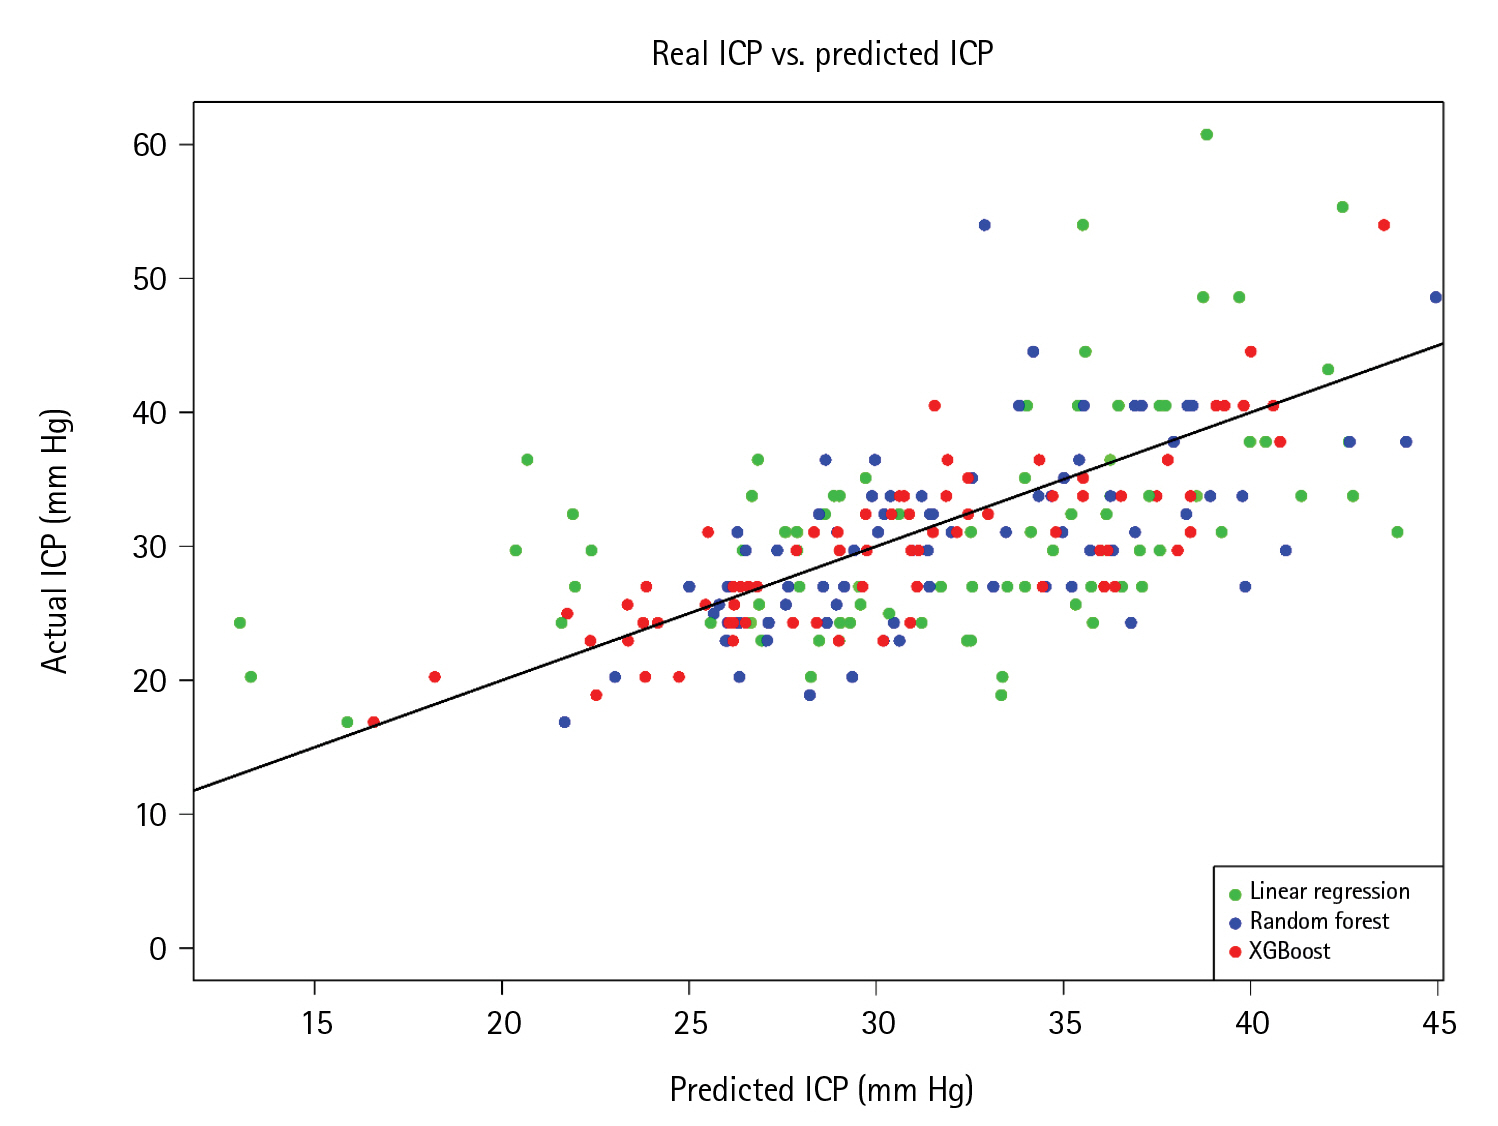
Scatterplots of actual and predicted intracranial pressure (ICP) among linear regression, random forest, and extreme gradient boosting (XGBoost) using test data with the third model.

A screen capture of the sample web application for predicting intracranial pressure (ICP). ONSD: optic nerve sheath diameter.
DISCUSSION
In previous studies, the relationships between ONSD and ventricular indexes to ICP have remained unclear [6-8]. Here, we found that ONSD was significantly correlated with ICP using linear correlation. The concordance results in this study were like those reported by previous studies [5,18]. Lee et al. [5] revealed a significantly positive link between ONSD and ICP, with a yield of enhanced ICP categorization by the area under the receiver operating characteristic curve (AUC) of 0.834, whereas Jeon et al. [18] found that ONSD was associated with increased ICP and reported an AUC of 0.936.
While ONSD correlated statistically and significantly with ICP, none of the ventricular markers showed a correlation, consistent with the findings of Kavi et al. [6]. Although there were no statistical connections between ventricular indexes and ICP in the present study, we discovered that these indexes were useful for ICP prediction using ensemble learning. When ventricular indexes were included in the second strategy of model development, the R2 value, which reflects the percentage of explanation by independent variables, increased. According to logical explanation, ventricular indexes represent the severity of the ventricular size that should directly affect ICP [14].
Both the XGBoost and the RF ensemble learning algorithms had low MAE and RMSE values for ICP prediction. Datasets with vital features provide additional information through meaningful modeling and enhanced performance of the prediction [19]. In addition, XGBoost and RF algorithms had high predictive performances.
The XGBoost algorithm has been used extensively for predicting clinical outcomes in neurosurgery, including in glioma [20], traumatic brain injury [21], spinal cord injury [22], and subarachnoid hemorrhage [23]. However, research that discusses the predictive performance of continuous variable outcomes is lacking. While RF regression was used to predict continuous variable outcomes from the literature review, Tunthanathip et al. [24] reported RF regression that was effective and precise enough to predict the number of units of blood product necessary for a brain tumor operation. Moreover, ML could optimize the over-requesting of preoperative blood products and reduce preoperative costs by 47.88%–67.88% [24].
Although the XGBoost and RF algorithms allow fewer errors than linear regression for ICP prediction, clinicians in general practice may be comfortable with the simplicity of linear regression. As a result, the user-friendliness of a tool is one of the most important criteria linked to physician utilization in the real world. We developed an ML-based online application that only requires predictor variables to be entered, after which cloud ML models will output the expected ICPs. This deployment is in concordance with other research reports [24,25].
To the best of our knowledge, the present study was the first to use various ML regression models to predict ICP in patients with HCP. Therefore, ML may be an alternative non-invasive procedure for application in patients who have contraindications, such as unstable vital signs or coagulopathy. However, the limitations of the present study should be noted. There have been several techniques of ONSD measurement used in prior studies, such as ultrasonography [18] and cranial CT imaging [5-7]. An axial view of a cranial CT scan is one of the acceptable methods, whereas ONSD measurement by ultrasonography may be limited by operator dependence [7]. To validate generalizability, the ML model needs to be estimated using additional data for improvement of predictive performance [26,27].
Ensemble learning techniques, including XGBoost and RF algorithms, are useful for estimating preoperative ICP and prognosticating HCP in patients. Furthermore, ML-based prediction may be an effective non-invasive approach to use in future challenges.
KEY MESSAGES
▪ Hydrocephalus is a major issue for neurosurgical patients that can result in death and disability.
▪ Machine learning is currently being used to predict a variety of therapeutic outcomes in different neurosurgical domains.
▪ Machine learning algorithms are helpful for predicting intracranial pressure in patients with hydrocephalus.
Notes
CONFLICT OF INTEREST
No potential conflict of interest relevant to this article was reported.
FUNDING
None.
AUTHOR CONTRIBUTIONS
Conceptualization: TT. Methodology: TT. Formal analysis: TT. Data curation: AT. Visualization: TT. Project administration: TT. Funding acquisition: TT. Writing–original draft: all authors. Writing–review & editing: TT.
Acknowledgements
None.