Study of the gut microbiome as a novel target for prevention of hospital-associated infections in intensive care unit patients
Article information

Abstract
Background
Hospital-acquired infections (HAIs) are increasing due to the spread of multi-drug-resistant organisms. Gut dysbiosis in an intensive care unit (ICU) patients at admission showed an altered abundance of some bacterial genera associated with the occurrence of HAIs and mortality. In the present study, we investigated the pattern of the gut microbiome in ICU patients at admission to correlate it with the development of HAIs during ICU stay.
Methods
Twenty patients admitted to an ICU with a cross-matched control group of 30 healthy subjects of matched age and sex. Quantitative SYBR green real-time polymerase chain reaction was done for the identification and quantitation of selected bacteria.
Results
Out of those twenty patients, 35% developed ventilator-associated pneumonia during their ICU stay. Gut microbiome analysis showed a significant decrease in Firmicutes and Firmicutes to Bacteroidetes ratio in ICU patients in comparison to the control and in patients who developed HAIs in comparison to the control group and patients who did not develop HAIs. There was a statistically significant increase in Bacteroides in comparison to the control group. There was a statistically significant decrease in Bifidobacterium and Faecalibacterium prausnitzii and an increase in Lactobacilli in comparison to the control group with a negative correlation between Acute Physiology and Chronic Health Evaluation (APACHE) II score and Firmicutes to Bacteroidetes and Prevotella to Bacteroides ratios.
Conclusions
Gut dysbiosis of patients at the time of admission highlights the importance of identification of the microbiome of patients admitted at the ICU as a target for preventing of HAIs.
INTRODUCTION
Hospital-acquired infections (HAIs) are increasing in frequency due to the spread of multi-drug resistant organisms which abraded the ability of any healthcare setting to treat such these infections [1]. Healthcare facilities could not depend on traditional infection control measures only. Recent clinical trials settled many protocols to be used in the intensive care unit (ICU) to modulate the microbiome to prevent or treat infections [1-3].
The gut microbiome plays vital roles in digestion, synthesis of vitamins, drug metabolism, protection from infection, and recovery from illness. A balanced gut microbiome increases the host's defense against infection by regulating the local and systemic immune system, inhibiting the growth of enteric pathogens plus supporting epithelial barrier integrity required for the protection against the systemic dissemination of pathogens [4,5]. Several studies reported that dysbiosis in patients in the ICU may increase their susceptibility to healthcare-associated infections and poor outcomes [6-9]. Probiotics replacements has been proposed as a promising treatment to preserve gut integrity and arrest the loss of intestinal epithelial barrier function that is linked to sepsis and systemic inflammatory response syndrome [10].
The use of probiotics as a preventive measure has shown to have promising effects in many studies to avoid infection and to improve recovery in ICU patients, whereas the use of prophylactic antibiotics has been linked to a rise in antibiotic resistance in addition to its high cost [11]. Recently, probiotic studies got the directions of characterization of the actual ICU dysbiosis using microbiome profiling and personalize the ideal probiotic therapies to be administered [12]. Characterizing ICU microbiome changes could be crucial for directing the establishment of probiotic and symbiotic diagnostic and therapeutic approaches using microbiome profiles. Because of this evidence and considerations, the present study aims to describe the gut microbiome profile in ICU patients and to correlate it to the development of HAIs.
MATERIALS AND METHODS
All procedures performed in the study involving human participants were in accordance with the ethical standards of the Institutional Research Committee of Medical Research Ethics Committee of Alexandria Faculty of Medicine, Egypt (No. 00012098) and with the 1964 Helsinki declaration and its later amendments or comparable ethical standards. Written informed consent was obtained from each individual or a competent charged person in case of the patient's incompetence for inclusion in the study.
Patients
The study was conducted on 20 ICU patients admitted for noninfectious causes to the ICU. They were followed up during their stay in the ICU for the development of HAIs or not. A cross-matching control group of 30 healthy subjects of similar age and sex were also included. We included all adult patients admitted to the ICU without specific diagnosis as the ICUs serve a mixed population of medical, trauma, toxicological and neurologic patients.
Our exclusion criteria were chosen to cover several conditions that can independently affect the gut microbiota including: (1) severe chronic liver impairment (including liver cirrhosis, hepatic fibrosis, end-stage liver diseases or hepatocellular carcinoma); (2) chronic renal impairment (chronic kidney disease); abnormalities of kidney function or structure present for more than 3 months) including patients with end stage renal disease; (3) inflammatory bowel diseases including Crohn disease and ulcerative colitis; (4) patients with diabetes mellitus as well as known immunodeficiency (e.g., leukemic patients, patients on steroids, oncology patients receiving chemotherapy); (5) patients with sepsis from the start; (6) patients with the previous admission within 6 months; and (7) before intake of antibiotics.
History and Clinical Data
A detailed history was taken from patients and controls. All patients and controls were subjected to full clinical examination. Body weight and height were measured, and body mass index (BMI) was calculated. All patients underwent physical examination and assessment of medical device usage, including mechanical ventilators, urinary catheters, and peripheral or central venous catheters.
Laboratory Investigations
The Acute Physiology and Chronic Health Evaluation (APACHE) II score was calculated upon admission for precise information on the patient's acute severity of illness and predicting hospital mortality among critically ill adults. Each of the 12 variables is translated into weights using the original APACHE score and helps to stratify a patient's risks [13]. These variables include: (1) temperature (rectal ° C), (2) mean arterial blood pressure (mm Hg), (3) pulse, (4) respiratory rate (ventilated or not ventilated), (5) oxygenation (FiO2 ≥0.5 or FiO2 <0.5), (6) arterial pH, (7) serum sodium level (mmol/L), (8) serum potassium level (mMol/L), (9) serum creatinine (mg/100 ml), (10) hematocrit %, (11) white blood cell (×103/µl), and (12) Glasgow coma score.
Gut Microbiome Analysis
Sample collection, preservation, and transport
Stool samples were collected from controls, kept at –20 °C upon defecation at home, and delivered frozen to the main microbiology laboratory. For the ICU patients, the stool samples were collected within 72 hours after admission (before antibiotic treatment), and at once transferred to the lab. All the samples were stored at −80 °C for further processing.
DNA extraction
DNA was extracted from 180 mg stool samples using Biamp Fast DNA Stool Extraction Mini Kit (Qiagen). The resulting DNA extracts were stored at –80 °C until polymerase chain reaction (PCR) analysis.
SYBR green real-time PCR
Oligonucleotide primers targeted the 16S ribosomal RNA (rRNA) gene sequences of selected phyla, genera, or species constituting the gut microbiota (Bacteroides, Prevotella, Ruminococcus, Bacteroidetes, Firmicutes, Bifidobacterium, Lactobacillus, Akkermansia muciniphila, Faecalibacterium prausnitzii, and Clostridioides difficile). Universal bacterial primers were used to determine the total bacteria in the DNA extract, the amplification of which served as the denominator against which the amplification of the other bacteria was compared. Specific bacterial DNA was expressed relative to the total (universal) bacteria DNA in the stool samples by the RQ software (Qiagen). All primers (Invitrogen) used in the study were previously described and are listed in Table 1 [14].
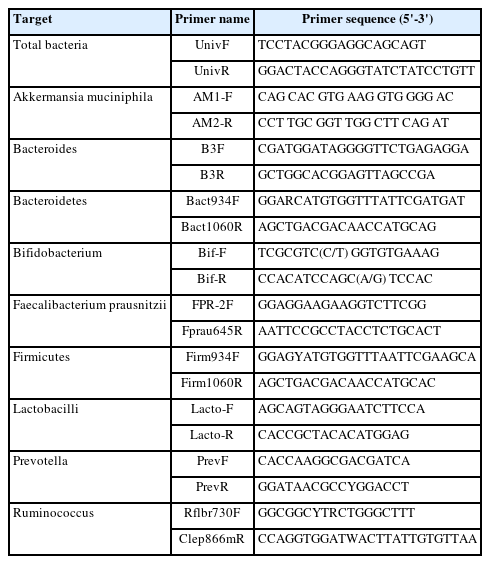
Primers used in the present study
Detection and Quantitation
Amplification was performed in a light cycler (Rotor-Gene Q, Qiagen) using a SensiFAST TM SYBR No-ROX PCR kit (Bioline Co.). In short, forward and reverse primers (4 pmol each) were used in 20 μl reactions having 2 μl of the DNA extract. PCR amplification was performed with an initial denaturation at 95 °C for 10 minutes, followed by 40 cycles of denaturation at 95 °C for 30 seconds, annealing at 60 °C for 30 seconds, and extension at 72 °C for 30 seconds. Melting curve analysis was performed to check the specificity of the amplified products. Quantitation of specific bacterial DNA was expressed as relative quantitation (the cycle threshold [Ct] at which DNA for a specific target was detected relative to the Ct at which universal bacterial DNA was detected). This relative quantification is calculated automatically by the Rotor-Gene software and expressed as a relative fold difference [15]. The enterotype of all participants was figured out according to the dominant bacteria present in the three bacteria: Bacteroides (Enterotype 1), Prevotella (Enterotype 2), or Ruminococcus (Enterotype 3).
Statistical Analysis of the Data
Data entry and analysis were carried out using the IBM SPPS ver. 20 (IBM Corp.) [16]. Spearman correlation coefficient was calculated for assessing correlation. All results were interpreted at a 5% level of significance where the difference between the study groups is considered significant if P ≤0.05. The Shannon diversity index is used to measure alpha diversity within the sample [17]. The Bray-Curtis similarity index was used to evaluate the degree of similarity between patients and controls [18].
RESULTS
Characteristics of the Participants
Demographic and clinical data of cases
Demographic data showed that out of the 20 patients admitted to the ICU, 8 patients were males, and 12 patients were female with male to female ratio of 2:3. Their mean and standard deviation (SD) age was 51.85±22.73 years, and their age ranged from 18 to 80 years. The BMI ranged between 24.69 and 34.89 kg/m2 with a mean of 28.27±2.90 (Table 2). For the cross-matched control subjects, 13 were males, and 17 were females with male to female ratio of 1:1.3. Their mean age was 52.53±17.84 years, and their ages ranged from 23 to 81 years. The BMI ranged between 19.84 and 46.90 kg/m2 with a mean of 28.77±5.31 kg/m2 (Table 2). Among patients at the ICU, 14 patients (70%) had neurological insults; as shown in Table 2, three patients (15%) were with cardiopulmonary diseases while three patients (15%) with different medical conditions.

Comparison between the studied groups according to demographic data
Regarding the APACHE II score, the mean was 13.25±4.56 ranging from 7.0 to 21.0. Out of the 20 ICU patients, 13 (65%) were on mechanical ventilation, 15 (75%) had a central venous catheter, and all with urinary catheters and peripheral intravenous catheters. Also, out of the 20 patients, 8 (40%) were fed through a nasogastric tube, 6 (30%) through an orogastric tube and 6 (30%) orally fed (Table 3).
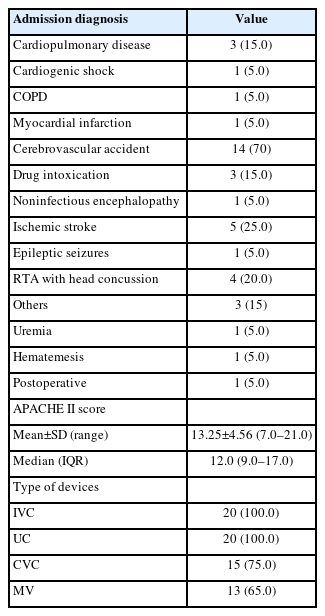
Distribution of the studied cases according to clinical data of the ICU patients (n=20)
During the patient's stay in the ICU and follow-up period, eight patients (40%) developed HAIs; seven of 20 (35%) Acinetobacter ventilator-associated pneumonia (VAP) and only one case of Staphylococcal bloodstream infection (BSI). All these cases were on mechanical ventilation and had a central venous catheter. Also, five of them (62.5%) were fed through a nasogastric tube and three (37.5%) through the orogastric tube (Table 3).
By comparing both subgroups of cases positive for hospital-associated infections (P-HAI) and negative for hospital-associated infections (N-HAI) about the APACHE score and ≥20% predicted mortality rate, it was higher in the P-HAI cases than N-HAI, but the difference was not statistically significant. There is a statistical difference between both subgroups regarding the number of devices specifically mechanical ventilation and the presence of central venous catheters (P<0.05).
Gut Microbiome Analysis
QQuantification of certain bacteria DNA was represented relative to the total amount of bacteria DNA found in the faeces sample rather than as an absolute number. The relative abundance values for the different bacteria were displayed as follows (4.75E-05 was used to represent 4.75 ×10⁻⁵).
Phylum Level Analysis
Bacterial phylum analysis revealed that, although Bacteroidetes were increased, the difference was not statistically significant when compared to the control group, and ICU cases showed a statistically significant decline in Firmicutes (P=0.001). Firmicutes/Bacteroidetes (F/B) ratio in ICU cases was 0.03 compared to 1.44 in control subjects, a markedly lower ratio (P=0.008) (Table 4).
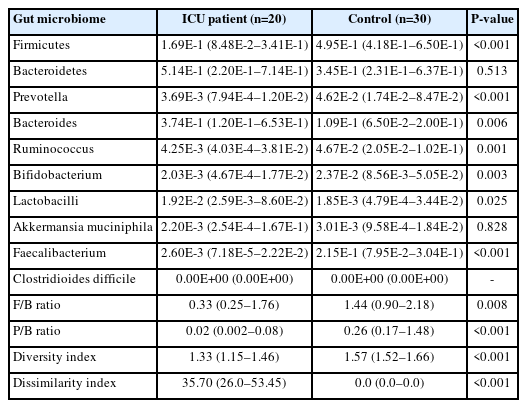
Comparison between the studied groups according to Gut microbiome
The same results were obtained when subgrouping ICU patients and comparing the subgroup of patients who developed HAIs and those negative for the HAIs subgroup. Both subgroups a statistically significant decrease in Firmicutes (P=0.001) in comparison to the control group and there was also a statistically significant difference between the two subgroups (Figure 1). As regards the Bacteroidetes, the developed HAIs subgroup cases showed no statistically significant difference compared to the control group and N-HAIs subgroup. The F/B ratio was statistically lower in the P-HAIs subgroup (0.31) compared to the N-HAIs subgroup (2.21) and the control group (1.44) (Table 5, Figure 1).
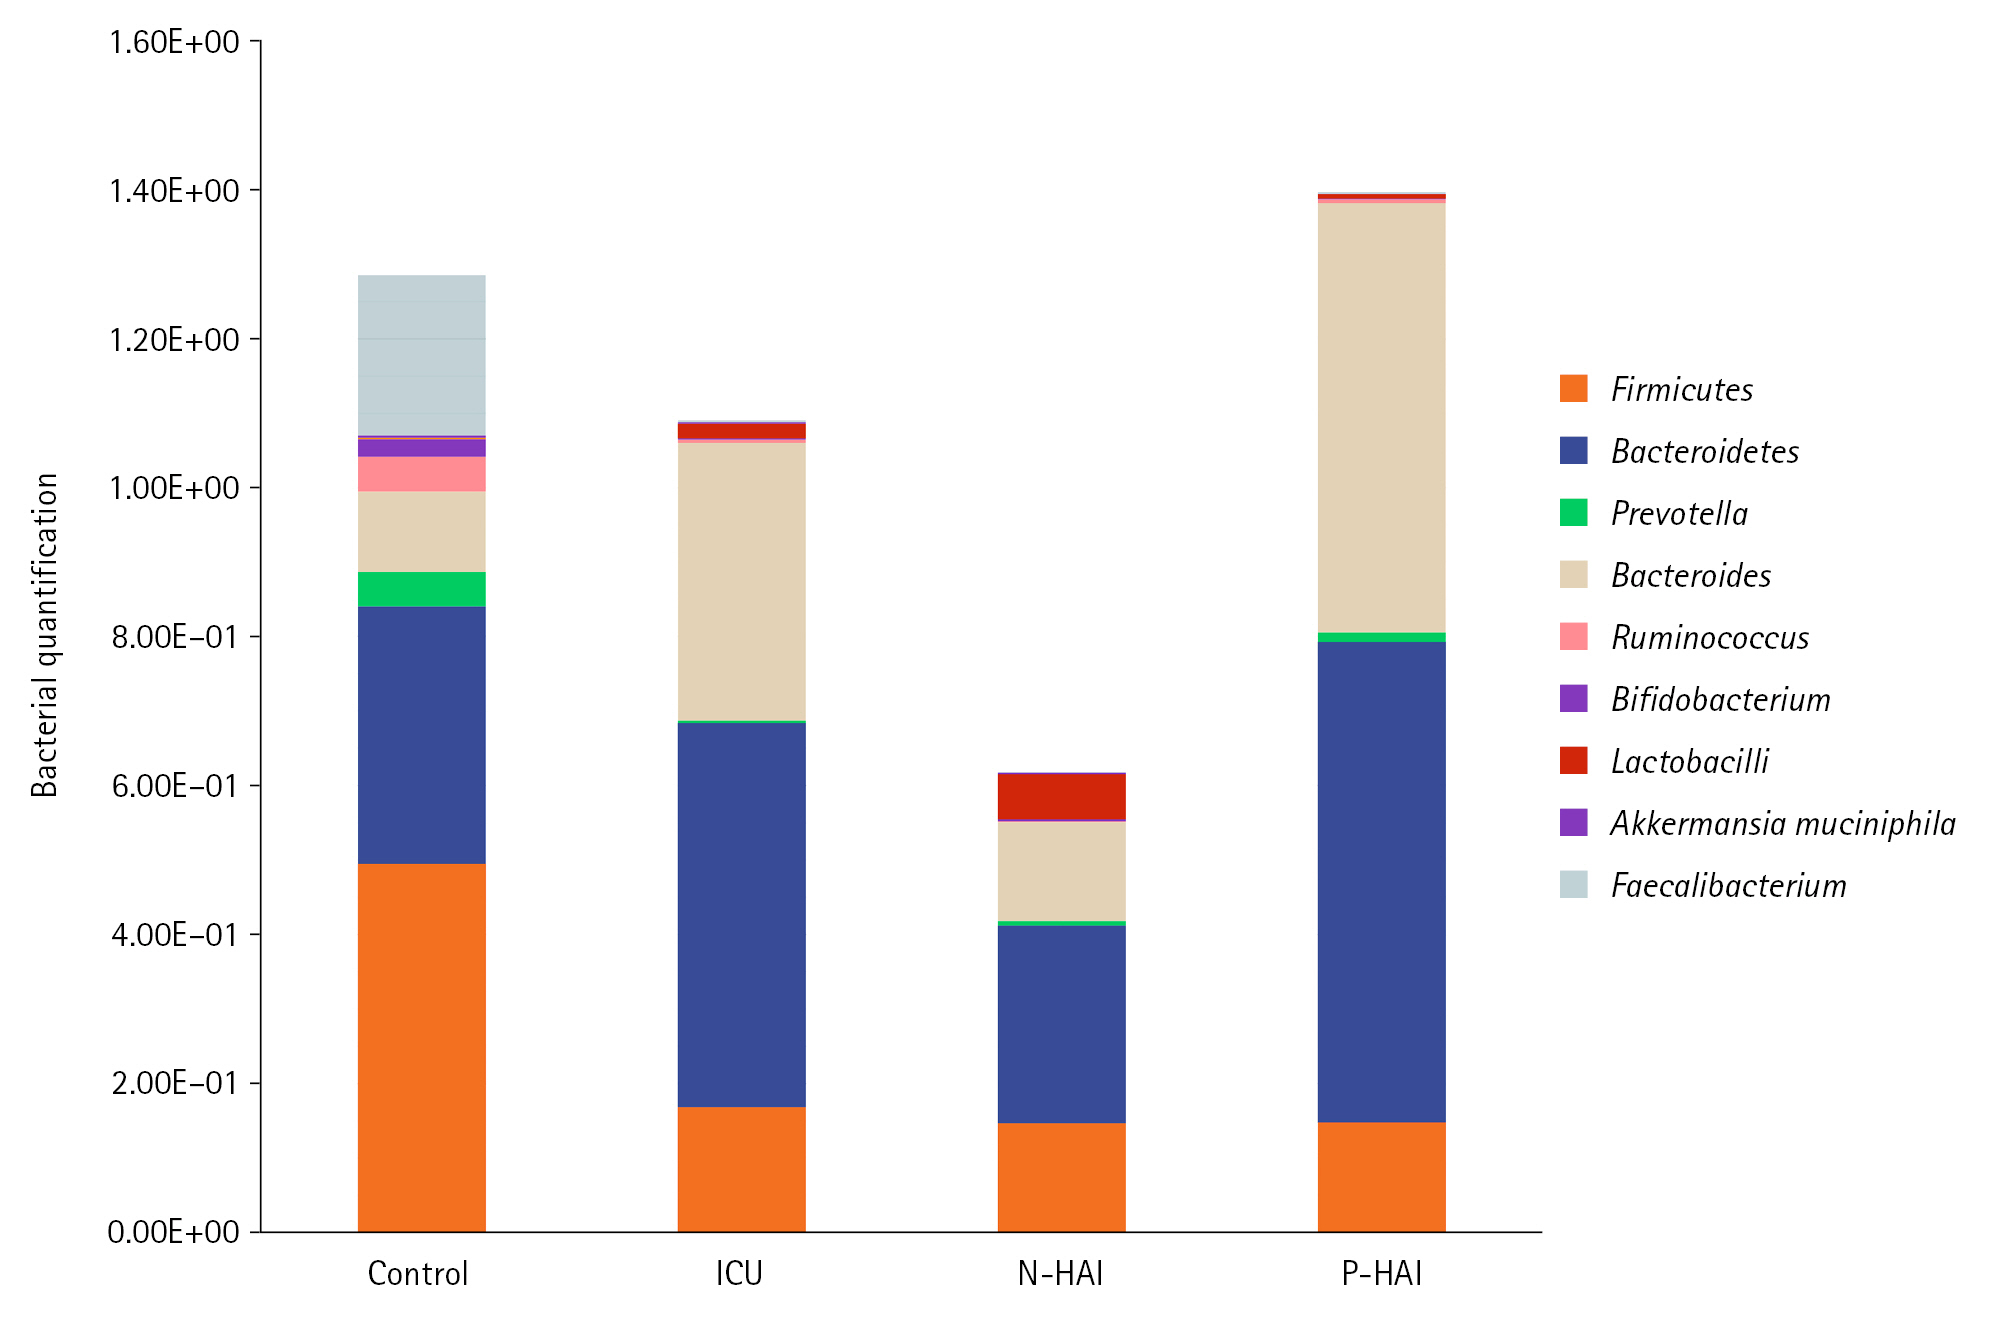
Comparison between the studied groups according to gut microbiome. ICU: intensive care unit; N-HAI: negative for hospital associated infections; P-HAI: positive for hospital-associated infections.
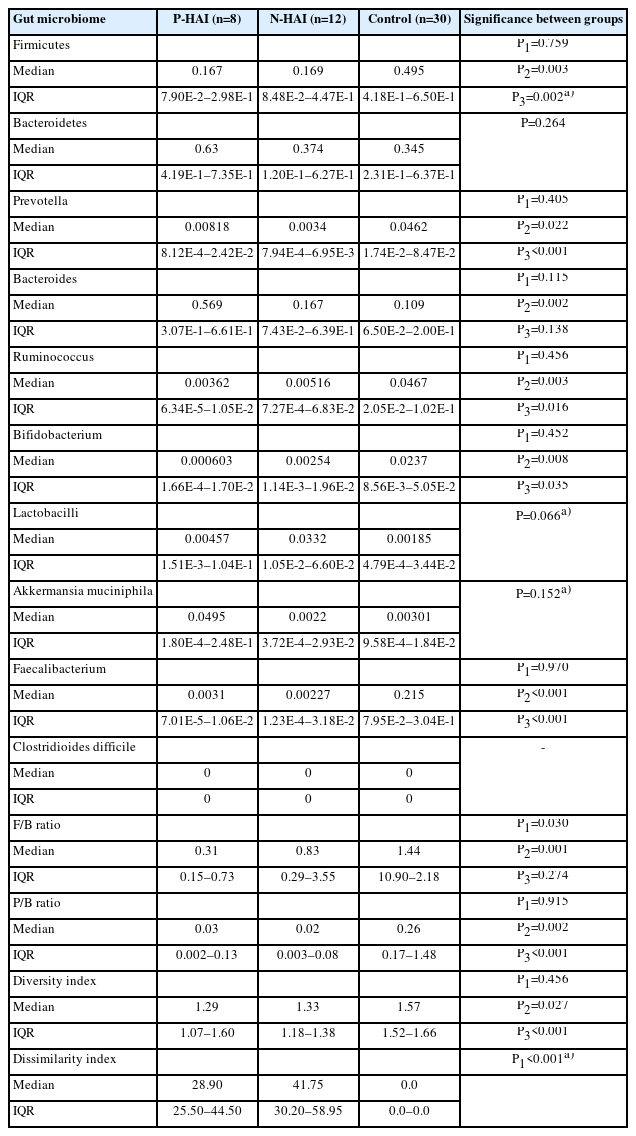
Comparison between the two studied subgroups according to gut microbiome
Patients who developed HAI were subdivided into patients who developed VAP and a patient with BSI, when comparing these patients there was not a significant difference between them in the gut microbiome composition while there was a significant difference regarding the F/B, Prevotella/Bacteroides (P/B) ratio or DSI.
Genus Level Analysis
Compared to the control group, ICU patients had a statistically significant increase in Bacteroides relative abundance (P=0.002) (Figure 1). As for Prevotella and Ruminococcus, there was a statistically significant difference between ICU patients and control cases (P=0.001). In comparison to the control group (0.26), the P/B ratio was significantly lower in the ICU patients (0.02) (Table 4).
For the two subgroups of ICU patients, both showed a lower relative abundance of Prevotella and Ruminococcus in comparison to the control group and there was no statistically significant difference between the two subgroups. On the other hand, the P-HAls subgroup showed a statistically significant higher relative abundance of Bacteroides compared to the control group while there was no statistically significant difference between the N-HAIs subgroup and the control group. Also, both subgroups showed a lower P/B ratio in comparison to the control group, however, there was no statistically significant difference between the two subgroups (Table 5).
According to the enterotype analysis, none of the 20 ICU patients had the enterotype 3 and just one (5% of them) had the enterotype 2. Of the 30 control participants, 18 (60%) were allocated to Enterotype 1, 9 (30%) to Enterotype 2, and 3 (10%) to Enterotype 3. Regarding the distribution of enterotypes, a statistically significant difference between the two groups was found (P=0.017) (Table 6), however, there was no statistically significant difference P-HAI and N-HAI subgroups (P=0.087).
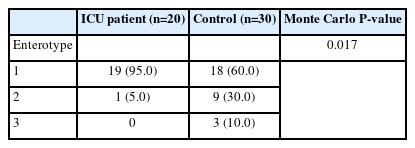
Comparison between the studied groups according to enterotype
Species Level Analysis
Regarding the beneficial bacteria, compared to the control group, ICU patients had statistically significant lower levels of Bifidobacteria (P=0.003) and F. prausnitzii (P=0.001) and higher levels of Lactobacilli (P=0.025). For Akkermansia muciniphila, there was no significant difference in A. muciniphila (P=0.828) between the two groups. As regards C. difficile, all the cases and control subjects were negative.
Correlation with Disease Severity and Mortality
There was a negative correlation between the APACHE score and F/B, and P/B ratios. When subgrouping ICU cases about mortality rate according to APACHE score; ≤20% and >20 % mortality rates. There was a significant decrease in the F/B ratio in patients with a mortality rate >20 % and those with ≤20 % mortality rate and between the F/B ratio in patients with a mortality rate >20 % and control (P1=0.026 and P3=0.001, respectively). P1 means P-value for comparing between <20% mortality and ≥20% mortality; P3 means P-value for comparing between ≥20% mortality and control.
Alpha Diversity
According to Shannon diversity index, which takes into account both species richness and evenness, the patients group's microbial diversity was statistically significantly lower than that of the control group (mean diversity index=1.16 vs. 1.46). The patient's P-HAIs and N-HAIs showed no statistically significant difference.
DISCUSSION
Gut microbiota composition alterations (dysbiosis) has been confirmed to occur not only in chronic diseases but also in acute illnesses [19]. Within hours of the commencement of serious illness, the density and makeup of the microbiota are significantly changed which promotes diseases and facilitates the occurrence of HAIs as it replaces the healthy microbiome [20]. There is growing data that suggests changes in the F/B ratio could be a marker of gut dysbiosis [21]. Firmicutes convert lactic acid to butyric acid, which induces mucin formation and so prevents leaky gut syndrome while Bacteroidetes, on the other hand, convert lactic acid to other short-chain fatty acids such as acetic acid, formic acid, or propionic acid that harm the gut lining. As a result, it is very important to maintain a larger percentage of butyrate-producing bacteria [22].
The altered F/B ratio has been correlated with different disease conditions such as obesity, asthma, and irritable bowel syndrome as well ICU mortality in critically ill patients [23,24]. A single-center prospective study includes twelve ICU patients and showed that changes in the gut microbiota can be linked to patient prognosis [25].
However, another study by Iapichino et al. [26] stated that low bacterial diversity was observed in both septic and non-septic patients, and discovered no links between the microbiota's diversity, the F/B ratio, or the ratio of Gram-positive to Gram-negative bacteria and outcome indicators like the occurrence of complications, infections, or mortality.
In our study, the gut microbiome profile of those patients who developed HAI mainly VAP had a statistically significant decrease in Firmicutes in comparison to the control group as well it was found the F/B ratio was statistically lower in the P HAIs subgroup (0.31) compared to N-HAIs subgroup (2.21) and the control group (1.44). VAP is an infectious inflammatory reaction of lung parenchyma that takes place after mechanical ventilation for greater than 48 hours. VAP affects between 5% and 40% of patients on invasive mechanical ventilation and these variations depend on the country [27,28]. That agrees with our study results where 35% of patients developed VAP in the follow-up period during their stay in the ICU. Also, it was documented in an Egyptian study done by Elkolaly et al. [29], the incidence of VAP was 38.4% in all patients admitted to ICU which is very close to our study results.
Some studies showed different results, The incidence of VAP in ICUs in China has been studied (26.85%) [30]. Ahmed et al. [31] found that VAP occurred at an incidence of 58.2% in three ICUs. This could be due to differences in the recording systems used in various hospitals. As regards the beneficial bacteria; both ICU patients and patients who developed HAIs (VAP) showed a statistically significant decrease in Bifidobacterium in comparison to the control group as well it was significantly lower in patients with a mortality rate ≥20% predicted hospital mortality and the control group.
Regarding bifidobacteria ,in addition to improving food absorption and preserving the integrity of the intestinal gut barrier, as well as immunological control and anticancer characteristics, bifidobacteria are one of the main bacteria that constitute the human gut microbiota [32,33]. Xu et al. [34] proved the bifidobacterial abundance as a part of prognosis prediction parameters plus APACHE II and Sequential Organ Failure Assessment (SOFA) score and it was found that Bifidobacterium abundance showed a significant reduction in the death group than the survival group. Therefore, this abundance showed good prognostic tools in predicting hospital mortality. As proven, gut microbiome disruptions and imbalance have been associated with many negative consequences such as VAP and increased re-infection and readmission as well, therefore administration of probiotics at admission with potential benefit to the host can balance the dysbiosis problems by reconstituting the gut microbiome as preventative and therapeutic approaches [35].
The limitation of our study was the small sample size because of implementing the inclusion criteria and strictly applying the exclusion criteria to selected patients as well financial issues that limit our study as a part of the international economic crisis, the import of such bacterial primers and reagents for quantitative real-time PCR is so much difficult and so expensive, especially in resource-limited countries. Also, our findings are limited to a single study center so further multicenter studies with larger sample sizes are recommended. At last, for ICU patients, it is not so that simple that they can pass stool in the first 24–72 hours following admission due to a change in bowel habits and diet.
This study focuses on the analysis of the gut microbiome profile for ICU patients at admission to correlate it with the development of HAIs so it can be used as a predictor for HAIs. It proved that gut dysbiosis at admission with a low F/B ratio is a marker for developing HAIs during ICU stay, therefore the patient can benefit from restoring the normal gut microbiome at admission to prevent the development of such infections and so ICU stay and mortality.
Probiotics is one method of restoring the normal gut microbiome that needs further studies to evaluate its efficiency in preventing HAIs in ICU patients at admission. Probiotics deserve all of this concern as it can replace the prophylactic antibiotics administered during admission and so reducing the risk of developing antibiotic resistance.
KEY MESSAGES
▪ Intensive Care Unit patients are at considerable risk of developing Healthcare-Associated infections (HAIs), so the gut microbiome analysis can be used to prevent or reduce the occurrence of HAIs and the spread of multidrug-resistant organisms.
▪ Profiling the pattern of gut microbiome at admission can be used as a predictor for HAIs for further manipulation.
Notes
CONFLICT OF INTEREST
No potential conflict of interest relevant to this article was reported.
FUNDING
None.
AUTHOR CONTRIBUTIONS
Conceptualization: SAE, SMA. Data curation: SMA, SAE, GMS, AME. Formal analysis: SMA, SLA, AME. Methodology: SE, SMA, SLA, AME. Writing–original draft: all authors. Writing–review & editing: all authors.
Acknowledgements
We are grateful to the molecular biology laboratory in the medical microbiology and immunology department. We thank all healthcare personnel who helped in the collection of samples from intensive care unit patients who enrolled in the study.