Cytokine profiles in intensive care unit delirium
Article information

Abstract
Background
Neuroinflammation causing disruption of the blood-brain barrier and immune cell extravasation into the brain parenchyma may cause delirium; however, knowledge of the exact pathophysiologic mechanism remains incomplete. The purpose of our study was to determine whether cytokine profiles differ depending on whether delirium occurs in the setting of sepsis, coronavirus disease 2019 (COVID-19), or recent surgery.
Methods
This prospective observational cohort study involved 119 critically ill patients admitted to a multidisciplinary intensive care unit (ICU) during 2019 and 2020. Delirium was identified using the validated confusion assessment method for the ICU. Multiple delirium risk factors were collected daily including clinical characteristics, hospital course, lab values, vital signs, surgical exposure, drug exposure, and COVID-19 characteristics. Serums samples were collected within 12 hours of ICU admission and cytokine levels were measured.
Results:
The following proinflammatory cytokines were elevated in our delirium population: tumor necrosis factor (TNF)-α, interleukin (IL)-6, IL-18, C-C motif ligand (CCL) 2, CCL3, C-X-C motif chemokine ligand (CXCL)1, CXCL10, IL-8, IL-1 receptor antagonist, and IL-10. Analysis of relative cytokine levels in those patients that developed delirium in the setting of sepsis, COVID-19, and recent surgery showed elevations of CCL2, CXCL10, and TNF-α in both the sepsis and COVID-19 group in comparison to the postsurgical population. In the postsurgical group, granulocyte colony-stimulating factor was elevated and CXCL10 was decreased relative to the opposing groups.
Conclusions
We identify several cytokines and precipitating factors known to be associated with delirium. However, our study suggests that the cytokine profile associated with delirium is variable and contingent upon delirium precipitating factors.
INTRODUCTION
Delirium is a neuropsychiatric syndrome that involves altered cognition, impaired awareness, inattention, disorganized thinking, and fluctuating arousal [1-10]. Its onset can be acute or subacute [2,3,5-11], it can occur in hypo- or hyperactive forms [2,4-6], and its consequences can be devastating [3,4,12-14]. Patients who experience delirium are at increased risk of death, dementia, and institutionalization [2,3,6,12,15,16]. Furthermore, the economic burden of delirium is profound. Delirium related healthcare expenditures in the United States are estimated to exceed $150 billion annually [3,6,13]. This cost primarily results from increased length of hospitalization; on average, between 5–10 days greater than that of non-delirious patients [3]. Despite the prevalence of delirium and significant advances in the understanding of this syndrome made over the past decade, knowledge of its underlying pathophysiologic mechanisms remains incomplete [2,10,12,17,18].
Studies have shown that proinflammatory cytokines are associated with delirium [1,2,7-10,12,13,19-25]. The neuroinflammatory hypothesis states that the clinical manifestations of delirium result from systemic inflammation causing loss of integrity of the blood-brain barrier, microglial activation, and immune cell extravasation into the brain parenchyma [8,11,13,20,23,26,27]. Inflammation is promulgated by the release and deposition of several cytokines and chemokines; previous studies have identified tumor necrosis factor (TNF)-α [2,6-9,13,19-21,24,25], interleukin (IL)-6 [2,6,8,9,19-22,25], and IL-10 [8,9,19,21], amongst others, as contributing factors. However, there is disagreement regarding the exact composition of the inflammatory milieu that produces delirium [2,8-10,19-25,28], perhaps suggesting that the clinical phenotype of delirium is the final pathway of discrete neurophysiological conditions [1].
Delirium results from a variable combination of predisposing factors unique to the individual and precipitating factors [2,16,17,27,29-33]. Acute stressors associated with delirium are well characterized and include critical illness and surgery, both of which are associated with the release of inflammatory cytokines [2,6,8-10,13,19-25,28]. The objective of our study was to further characterize the association between various precipitating factors with the development of delirium, including a comprehensive analysis of cytokine responses in those patients that developed delirium versus those that did not. Previously, studies that have investigated cytokines associated with delirium have focused on delirium resulting from a single etiology or did not differentiate by condition that precedes the onset of delirium.
In this study, we sought to determine whether cytokine profiles associated with delirium vary based on the precipitating condition. Our focus was on delirium resulting from sepsis, coronavirus disease 2019 (COVID-19), and recent surgery. This study is novel in that it is the first to investigate relative levels of inflammatory cytokines that result from several conditions known to be associated with delirium. Furthermore, although recent studies have reviewed the association between cytokines elevated in COVID-19 and neurocognitive effects [34-36], our study aims to measure levels of cytokines in order to characterize the unique cytokine profile associated with COVID-19 delirium relative to that of delirium resulting from other causes. Further understanding in this realm is of preeminent importance as the pathophysiology of COVID-19 associated delirium remains incomplete.
METHODS
Study Population
This prospective observational cohort study was conducted from May 1, 2019, to October 31, 2020 at a 30-bed multidisciplinary intensive care unit (ICU) in Mayo Clinic Hospital, Phoenix, AZ, USA. This ICU is fully staffed by intensivists 24/7. Approval was provided by the Institutional Review Board of Mayo Clinic prior to initiation of data collection; the need for patient consent was waived. This study was performed in accordance with the Helsinki Declaration pertaining to medical research involving human subjects.
Daily ICU admissions were screened by the investigators for assessment of inclusion and exclusion criteria. Inclusion criteria: consecutive critically ill patients ≥18 years of age admitted to the ICU during the study period. Exclusion criteria included DNR/DNI and comfort care patients, presence of delirium at the time of ICU admission, patients presenting due to stroke or traumatic brain injury, and patients who had not agreed to the use of their medical records for research. When patients required readmission to the ICU after discharge, only data from the first admission were analyzed. For the purposes of this study, we utilized the third International Consensus Definitions (Sepsis-3) to define both sepsis and septic shock [37].
Data Collection
Comprehensive data on patient characteristics, hospital course, laboratory values, vital signs, surgical procedures, and medication administration was collected on all study enrolled patients throughout their hospitalization. The validated confusion assessment method for the ICU (CAM-ICU) screening tool was used to identify delirium [38]. The CAM-ICU tool is administered by Mayo Clinic ICU nursing staff every eight hours or when a mental status change is noted. Positive and negative CAM-ICU results are documented in the electronic health record as events occurring during the following four-hour windows: 0:00–4:00, 4:00–8:00, 8:00–12:00, 12:00–16:00, 16:00–20:00, and 20:00–24:00. In those patients that underwent surgical procedures, inhaled anesthetic exposure, medication administration, and surgery characteristics data were also collected. Vital signs and laboratories were collected during the first ICU day; worse values were abstracted. The Acute Physiology Score (APS), Acute Physiology and Chronic Health Evaluation Score (APACHE) IV, and predicted hospital mortality rates based on these scores were calculated using an online APACHE IV calculator [39]. Sequential Organ Failure Assessment (SOFA) score [40] was documented daily from day 1 to day 7.
Serums samples were collected within 12 hours of ICU admission. Samples were transported at 4 °C and frozen at –80 °C within 12 hours of collection for later analysis. Routine chemicals were obtained from Sigma-Aldrich (St. Louis, MO, USA). The cytokines C-C motif ligand (CCL) 2, CCL3, C-X-C motif chemokine ligand (CXCL)1, CXCL10, granulocyte colony-stimulating factor (G-CSF), granulocyte-macrophage colony-stimulating factor (GM-CSF), IL-1α, IL-1β, IL-1 receptor antagonist (IL-1RA), IL-2, IL-4, IL-5, IL-6, IL-8, IL-10, IL-12, IL-17A, IL-18, and TNF-α were analyzed using a fluorescence-based capture sandwich immunoassay kit (Milliplex Human Cytokine, Chemokine, Growth Factor Panel A; Millipore, Burlington, MA, USA). The assay was performed in accordance with the manufacturer’s instructions using a Luminex 200 System (Invitrogen, Carlsbad, CA, USA) for reading fluorescence. Results were analyzed using xPONENT software as previously described by Singh et al. [41,42].
Statistics
All data are summarized as median (interquartile range) or percentages. Unpaired Student t tests will be used to compare continuous variables with normal distribution and the Wilcoxon rank test for skewed distribution. For comparison of categorical variables, chi-square tests will be used if the number of elements in each cell was ≥5; Fisher’s exact test will be used otherwise. A P-value ≤0.05 was considered statistically significant. All data analyses were performed using JMP ver. 14.1.0 (SAS Institute, Cary, NC, USA).
RESULTS
Of the 119 patients included in this study, 41 were diagnosed with delirium. The study population is described in Table 1. APS, APACHE IV, and both ICU and hospital length of stay (LOS) were greater in the group that developed delirium. Furthermore, sepsis, septic shock, COVID-19, continuous renal replacement therapy, extracorporeal membrane oxygenation, mechanical ventilation, leukocytosis, and acidemia were more prevalent in the population that developed delirium. Initial analysis showed that the age of patients that did not develop delirium was greater compared to those who did; however, after adjusting for LOS (longer LOS resulted in higher risk of developing delirium; surgical patients had a shorter LOS and were significantly younger), no age difference was noted between the two groups.

Patient characteristics
Table 2 includes surgical risk factors associated with delirium. Those patients who did not experience delirium were more likely to have had recent surgery and inhaled anesthetic exposure; no significant difference was seen between the non-delirium and delirium groups when considering blood loss from all surgical procedures, total surgical time, and total duration of inhaled anesthetic exposure.

Surgical risk factors
Potentially deliriogenic medications are provided in Table 3. Diazepam, midazolam, and dexmedetomidine use was associated with delirium; this relationship held with cumulative dose of both midazolam and dexmedetomidine. Opioid administration was also associated with the development of delirium; this was predominantly due to fentanyl and hydromorphone. Vancomycin, azithromycin, and piperacillin-tazobactam use were also associated with the development of delirium; however, no significance was seen when considering the cumulative dose of these medications. Our data did not show a significant relationship between corticosteroids or medications with anticholinergic properties with delirium.

Medications
Table 4 provides the cytokines associated with the development of delirium. Those cytokines found to be significantly elevated include the proinflammatory cytokines TNF-α, IL-6 and IL-18; the chemokines CCL2, CCL3, CXCL1, CXCL10 and IL-8; and the anti-inflammatory cytokines IL-1RA and IL-10. No significant difference was seen in levels of G-CSF, GM-CSF, IL-1α, IL-1β, IL-2, IL-4, IL-5, IL-12, and IL-17A between those patients that developed delirium and those that did not. Tables 5-7 divide the 41 patients in the delirium cohort by sepsis, COVID-19, and recent surgery, respectively. In the septic delirium population, consisting of 29 patients, CCL2, CXCL10 and TNF-α showed a statistically significant positive association with delirium while the level GM-CSF was decreased in comparison to the non-septic group. In the 20 patients with delirium and COVID-19, the levels of CCL2, CXCL10, and TNF-α were significantly elevated compared to the non-COVID-19 group. The levels of G-CSF and GM-CSF were decreased in those patients with COVID-19. In the eleven patients that had surgery prior to the onset of delirium, G-CSF levels were elevated in those patients with delirium while CXCL10 levels were decreased in the surgical group. Figure 1 provides a heatmap showing a ratio of median cytokine levels in each group of interest to that of the patients that did not comprise each group; statistically significant differences are highlighted. The groups in each column are as follows: delirium versus no delirium, sepsis versus no sepsis, COVID-19 versus no COVID-19, and recent surgery versus no recent surgery. Of note, dexmedetomidine showed a dose dependent direct relationship with CXCL1 and IL-1RA (P=0.03 and P=0.02, respectively).

Cytokines in total patient population by delirium
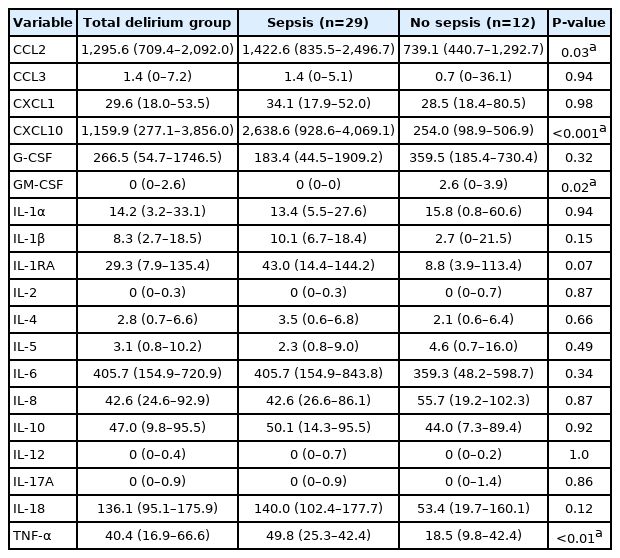
Cytokines in delirium group by sepsis

Cytokines in delirium group by COVID-19
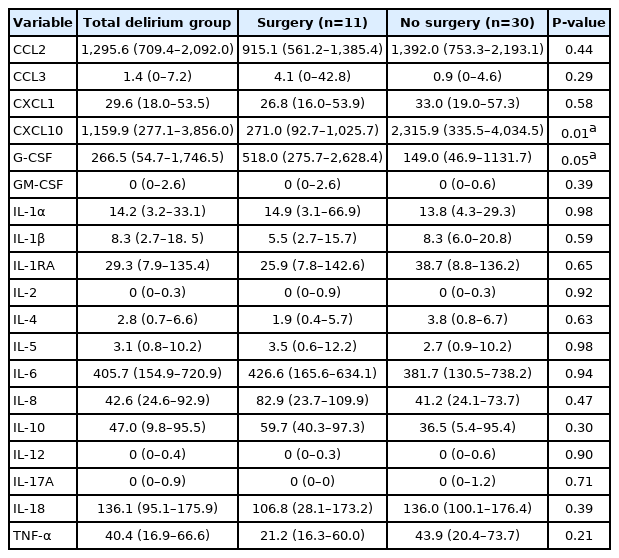
Cytokines in delirium group by recent surgery

Heatmap showing ratio of cytokine profile per group. If numerator or denominator is zero, cell omitted from heatmap. CCL: C-C motif ligand; CXCL: C-X-C motif chemokine ligand; G-CSF: granulocyte colony-stimulating factor; GM-CSF: granulocyte-macrophage CSF; IL: interleukin; IL-1RA: IL 1 receptor antagonist; TNF: tumor necrosis factor; COVID-19: coronavirus disease 2019. aP≤0.05.
DISCUSSION
We identified several cytokines associated with delirium in our ICU patient population. Interestingly, CCL2, CXCL10, and TNF-α showed a statistically significant elevation in those patients that developed delirium in the setting of both sepsis and COVID-19 relative to the group that recently had surgery and developed delirium. In those patients that developed postoperative delirium, G-CSF was significantly higher and CXCL10 was significantly lower. The discrete cytokine profile seen in our sepsis and COVID-19 groups relative to that of the surgery group supports the contention that the delirium syndrome represents a clinical phenotype that results from distinct pathophysiological mechanisms [2].
It is established that inflammation is associated with delirium; however, the exact mechanism by which this occurs has yet to be elucidated [2,8,10,19,20,43]. Regardless of the event that precipitates delirium, activation of toll-like receptors via pathogen- or damage-associated molecular patterns initiates an inflammatory cascade that leads to disruption of the blood brain barrier and ultimately results in this syndrome [2,6,8,9,13,19-21,25,44]. Peripheral inflammation triggers a microglial cell driven inflammatory process within the parenchyma of the brain resulting in leukocyte extravasation, increased cytokine expression, and further disruption of the blood brain barrier [2,8,11,13,20,43]. Studies have shown that TNFα acts upon microglial cells, resulting in the production of additional inflammatory cytokines and reactive oxygen species, and stimulates astrocytes to produce CCL2 and CXCL10 [2,43]. The presence of these cytokines and inflammatory mediators has been found to cause neuronal dysfunction [2,13,43]. Furthermore, expression of CCL2 and CXCL10 recruits additional leukocytes resulting in increased inflammation [2,43]. Delirium is associated with permanent structural brain changes. Such changes include cerebral atrophy, seen as a reduction in frontal lobe and hippocampal volumes, and cerebral white matter disruptions [1,3,5,14,29,30,43]. Specific neuronal pathology includes necrosis, apoptosis, atrophy, edema, and disruption of cellular architecture [1,8,11,23,32]. These structural changes may explain the persistent cognitive deficits common among those who have suffered from delirium [30]. TNF-α is believed to be the primary mediator involved in neuronal apoptotic cell death and sepsis associated long term cognitive deficits [41,45].
Considering the cytokine profile typical of delirium seen in both the sepsis and COVID-19 groups, the cytokine pattern in our surgery group is curious. Levels of TNFα, CCL2, and CXCL10 are decreased in those patients that recently had surgery and developed delirium relative to both the sepsis and COVID-19 groups. In the surgical group, the preeminent cytokine elevations were G-CSF and CCL3. This finding may suggest the existence of an alternative, non–TNF-α driven pathway of peripheral inflammation that resulted in delirium in our surgical patients.
Previous studies have identified TNFα and CCL2 as peripherally produced cytokines that play a central role in the development of delirium due to their effects on blood brain barrier integrity [2,10,13,19]. The question remains as to what could be driving blood brain barrier dysfunction in our postsurgical group. G-CSF has been identified as a cytokine that plays a critical role in regulating the transmigration of immune cells across the blood brain barrier [46-48]. However, it has been found to stabilize the blood brain barrier and may play a role in reducing inflammation; including by decreasing expression of TNF-α [47,48]. Furthermore, peripherally administered G-CSF has been found to protect against ischemic injury and carbon monoxide toxicity in rats [47]. Considering this, it is unlikely that G-CSF is the driver of delirium in our postsurgical group.
Several studies have identified CCL3 as playing an integral role in immune cell entry into the CNS [49-51]. Microvascular endothelial cells of the brain continuously express CCL3, which is significantly upregulated when exposed to other inflammatory cytokines [51]. In addition to being produced by endothelial cells, CCL3 is expressed by astrocytes, microglial cells, and macrophages secondary to neuroinflammation [51]. Studies have identified CCL3 as playing a similar role to CCL2 in inducing extravasation of leukocytes across the blood brain barrier in the setting of inflammation [49,50]. Although CCL3 levels were 4.5 times greater in the surgical delirium group than in the sepsis and COVID-19 delirium groups, this finding did not achieve statistical significance. However, CCL3 was found to be significantly elevated in the postsurgical delirium group in comparison to the patients that recently had surgery but did not develop delirium; this finding was not see in our sepsis and COVID-19 groups. Further investigation with a larger sample size is necessary to define the roles of both G-CSF and, conceivably, CCL3 in postsurgical delirium. It is possible that CCL3 plays a role in postsurgical neuroinflammation not seen in those patients who develop delirium secondary to sepsis and COVID-19.
Studies have shown that sedation with dexmedetomidine may reduce the frequency and duration of delirium [11,15,19,30,52]. Animal models suggest dexmedetomidine has neuroprotective effects, possibly by reducing expression of inflammatory mediators and microglial activation [11,52]. Our data did show a statistically significant relationship between dexmedetomidine dose and IL-RA levels; an immune modulating cytokine that inhibits IL-1 driven inflammation [21,22].
Our study had several limitations. The primary limitation was the modest size of our study population. We acknowledge this limitation and encourage future studies to confirm our results in a larger patient population; especially regarding the possible role of CCL3 in postsurgical delirium. In addition, cytokine levels were measured at a single point in time. Future investigations may benefit from trending cytokine levels in order to capture evolution of inflammatory mediator expression prior to the onset of delirium, throughout its course, and at resolution. Finally, surgery is a well-established risk factor for the development of delirium; this is a cytokine driven process [13,20,23]. However, surgical patients in our cohort were less likely to experience delirium. This unexpected finding is explained by the elective nature of many of the surgical procedures performed on older patients, with likely adequate cognitive reserve, that only required brief hospital courses and limited exposure to many of the precipitating factors of delirium.
In conclusion, our study demonstrates a statistically significant association between several cytokines and the development of delirium. However, the cytokine profile appears to be variable and contingent upon the delirium precipitating factors. In both sepsis and COVID-19, CCL2, CXCL10, and TNF-α predominate. In our surgical population, G-CSF is elevated and CXCL10 is decreased in patients that developed delirium. These findings provide support of the delirium syndrome representing a manifestation of distinct pathophysiological processes [2].
HIGHLIGHTS
▪ The cytokine profile seen in intensive care unit delirium appears to be contingent on the condition that precipitates its onset.
▪ In our patient population with sepsis and coronavirus disease 2019 (COVID-19), C-C motif ligand 2, C-X-C motif chemokine ligand (CXCL)10, and tumor necrosis factor-α predominate.
▪ In patients that developed postoperative delirium, granulocyte colony-stimulating factor is elevated and CXCL10 is decreased, relative to the COVID-19 and sepsis groups.
▪ These findings suggest that the delirium syndrome represents a manifestation of distinct pathophysiological processes.
Notes
CONFLICT OF INTEREST No potential conflict of interest relevant to this article was reported.
AUTHOR CONTRIBUTIONS
Conceptualization: RJS, CL, RCC. Data curation: VPS, ST, BK. Formal analysis: RJS. Methodology: RCC. Project administration: VPS, RCC. Writing–original draft: RJS. Writing–review & editing: CL, VPS, RCC.