Association between postoperative fluid balance and mortality and morbidity in critically ill patients with complicated intra-abdominal infections: a retrospective study
Article information

Abstract
Background
Postoperative fluid overload may increase the risk of developing pulmonary complications and other adverse outcomes. We evaluated the impact of excessive fluid administration on postoperative outcomes in critically ill patients.
Methods
We reviewed the medical records of 320 patients admitted to intensive care unit (ICU) after emergency abdominal surgery for complicated intra-abdominal infection (cIAI) between January 2013 and December 2018. The fluid balance data of the patients were reviewed for a maximum of 7 days. The patients were grouped based on average daily fluid balance with a cutoff value of 20 ml/kg/day. Propensity score matching was performed to reduce the underlying differences between the groups.
Results
Patients with an average daily fluid balance of ≥20 ml/kg/day were associated with higher rates of 30-day mortality (11.8% vs. 2.4%; P=0.036) than those with lower fluid balance (<20 ml/kg/day). Kaplan-Meier survival curves for 30-day mortality in these groups also showed a better survival rate in the lower fluid balance group with a statistical significance (P=0.020). The percentage of patients who developed pulmonary consolidation during ICU stay (47.1% vs. 24.7%; P=0.004) was higher in the fluid-overloaded group. Percentages of newly developed pleural effusion (61.2% vs. 57.7%; P=0.755), reintubation (18.8% vs. 10.6%; P=0.194), and infectious complications (55.3% vs. 49.4%; P=0.539) showed no significant differences between the two groups.
Conclusions
Postoperative fluid overload in patients who underwent emergency surgery for cIAI was associated with higher 30-day mortality and more frequent occurrence of pulmonary consolidation. Postoperative fluid balance should be adjusted carefully to avoid adverse clinical outcomes.
INTRODUCTION
There has been an ongoing debate about the relationship between positive negative fluid balance and patient survival [1-3]. Traditionally, surgeons have administered generous amounts of fluids perioperatively to correct the preoperative causes of hypovolemia, enhance tissue oxygen perfusion, and maintain urine output [4]. In critically ill patients, early and aggressive fluid resuscitation is fundamental in the treatment of hemodynamic instability and is known to improve patient survival [5]. According to the international guidelines for the management of sepsis, administering massive fluid to hemodynamically unstable patients during initial resuscitation is strongly recommended [6].
However, recent studies have suggested that fluid restriction may lead to fewer complications and shorter hospital stay; further, recent consensus statements support fluid restriction [2]. The perioperative care guidelines designed to promote early recovery among patients undergoing major surgery such as enhanced recovery after surgery pathways recommend that restricting fluids to achieve zero balance is a key component [7].
The preoperative condition of the patients in emergency settings would be more unstable than that of patients undergoing major elective surgery. Many reports and guidelines encourage health care providers to resuscitate patients with complicated intra-abdominal infections (cIAIs) with adequate amount of fluid because they are generally with fever, prolonged dehydration, and inflammatory responses, all of which increase the demand for intravascular volume [6,8,9]. On the other hand, fluid overload may cause tissue edema in the end organs and decrease their function. Kelm et al. [10] reported that fluid overload in patients with septic shock was associated with an increase in the acute need for fluid-related medical interventions (e.g., thoracentesis, paracentesis, ultrafiltration, and diuretics) and hospital mortality.
Although many research groups have reported their results regarding fluid balance and its effect on patient survival, only a few studies evaluated the association between postoperative fluid balance and outcomes in critically ill patients who underwent emergency surgery for cIAI [11,12]. As surgeons and intensivists, we conducted this study to determine the association between fluid administration and patient outcomes in the surgical intensive care unit (ICU). Our primary hypothesis was that higher overall fluid balance in patients with complicated intra-abdominal infection would lead to higher rates of pulmonary complications resulting in reintubation and increased mortality.
MATERIALS AND METHODS
The study was approved by the Institutional Review Board (IRB No. AJIRB-MED-MDB-18-455), and informed consents were waived because of the retrospective study design.
Study Population
We retrospectively reviewed the medical records of 1,581 adult patients who underwent emergency gastrointestinal surgery for cIAI from January 2013 to December 2018. We used guidelines from the World Society of Emergency Surgery and Surgical Infection Society to define cIAI. According to these guidelines, cIAI is defined as infections extended beyond originated hollow viscus into peritoneal cavity, abdominal wall, retroperitoneum, or other abdominal organs which are normally sterile area, whereas uncomplicated IAI is an infection confined to a hollow viscus [13,14].
Inclusion criteria were (1) patients who were admitted via emergency department, (2) received emergency operation for cIAI, and (3) needed postoperative ICU care for more than 48 hours. One thousand two hundred forty-six patients who did not meet these criteria were excluded. Fifteen patients who died within 72 hours after surgery were also excluded. As a result, 320 patients were selected for the final analysis. Patients were divided into two groups according to their average daily fluid balance which is divided by their body weight with a cut-off value of 20 ml/kg (Figure 1).
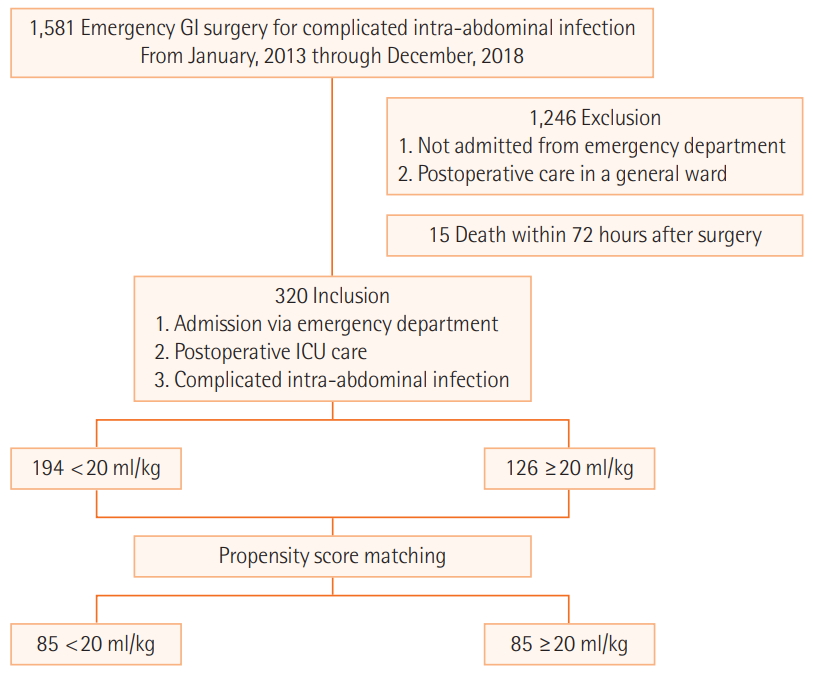
Study population. GI: gastrointestinal; ICU: intensive care unit.
Data Collection
Baseline characteristics of each patient were collected from the electronic medical records (Table 1). Indicators of initial status of patients in the preoperative period in the ED were also collected, and their Acute Physiology and Chronic Health Evaluation (APACHE) II, American Society of Anesthesiology (ASA) score, Quick Sequential Organ Failure Assessment (qSOFA) score, full sequential organ failure assessment (SOFA) score, and systemic inflammatory response syndrome (SIRS) were evaluated. The alert/verbal/painful/unresponsive responsiveness scale was used to calculate the full SOFA score (fSOFA) instead of the Glasgow coma scale (GCS) score [15]. Postoperative data including the numbers and days of vasopressor use, initial norepinephrine (NE) dose, highest NE dose, requirement for renal replacement therapy (RRT), full SOFA score at ICU discharge, and delta SOFA score were also collected. The delta SOFA score was calculated as ([SOFA at ICU discharge]– [initial SOFA])/[length of ICU stay in days]. The clinical outcome data, such as hospital length of stay, ICU length of stay, mechanical ventilation (MV) days, in-hospital mortality, and 30-day mortality were recorded.
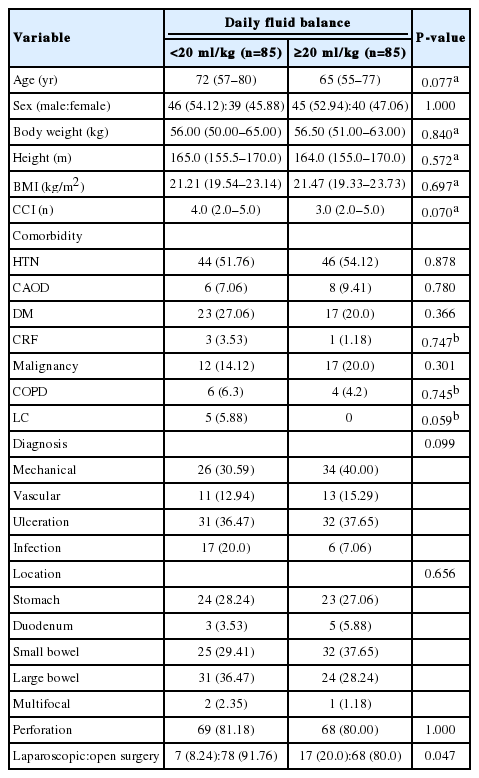
Baseline characteristics
Daily fluid intake, daily urine output, and daily input/output balance were also recorded. These parameters during their ICU stay up to 7 days were all summed up, and the average daily values were calculated. Average fluid balance is calculated by subtracting daily average output from daily average input and then dividing the values by body weight (kg) of the patients. As none of the patients had a negative fluid balance on the immediate postoperative day, fluid overload was defined as more than 20 ml/kg/day of the average daily fluid balance. The cutoff value was obtained with the receiver operating characteristic curve of 30-day mortality and average daily fluid balance. According to the curve, 20 ml/kg/day was the point where it showed the maximal sensitivity and specificity for 30-day mortality.
Combination of crystalloid fluid, such as 10% dextrose and normal saline, was commonly used in the immediate postoperative period. Fresh frozen plasma or albumin were used in selected cases only when appropriate according to the guideline [6]. Types of fluid, blood product, colloid, and amount of nutrition provision were not counted separately. Pulmonary consolidation and pleural effusion are recorded according to reports from chest radiology specialists. Pre-existing pleural effusions and pulmonary consolidations are distinguished from those newly developed during post-operative care. Infectious complications are also reviewed which are defined as newly occurred infections during postoperative care [16].
Statistical Analysis
Student’s t-test and Mann-Whitney U-test were used to compare the continuous variables between the two groups, which were expressed as mean ± standard deviation or median (interquartile range). The categorical variables were presented as frequency (%) and statistically compared using the chi-square or Fisher’s exact test, as appropriate. Kaplan-Meier survival curves and log-rank test were used to compare the 30-day mortality between the groups. Propensity score matching (PSM) was used to compensate for the differences in the baseline characteristics and initial status of patients in each group. Matching variables were weight, presence of preoperative shock, number of vasopressors used, initial NE dose, RRT, and pre-existing pneumonia. Data before matching are presented in Supplementary Tables 1-5. The findings were considered statistically significant when p values were less than 0.05. Statistical analysis was performed using IBM SPSS ver. 23.0 (IBM Corp., Armonk, NY, USA), SAS ver. 9.4 (SAS Inc., Cary, NC, USA), and R package ver. 3.1.3 (R Foundation, Vienna, Austria).
RESULTS
Before Matching
Before matching, body weight (60.77±11.27 vs. 56.08±10.13 kg; P < 0.001) and body mass index (BMI) (22.46 ± 3.18 vs. 21.29 ± 3.15 kg/m2; P=0.001) differed between the groups (Supplementary Table 1). ASA (P = 0.021), initial systolic blood pressure (SBP) (120 [101–141] vs. 110 [92–130] mm Hg; P = 0.002), and presence of preoperative shock (26.8% vs. 39.7%; P=0.022) also differed between the groups (Supplementary Table 2). Immediate postoperative data, such as the number of vasopressors used in the ICU (P < 0.001), NE days (3.0 [2.0–4.0] vs. 5.0 [2.0–8.0] days; P < 0.001), initial NE dose (0.091 [0.047–0.139] vs. 0.119 [0.071–0.247] μg/kg/min; P = 0.018), the highest NE dose (0.175 [0.099–0.380] vs. 0.376 [0.141–0.762] μg/kg/min; P<0.001), and application of RRT (3.6% vs. 24.6%; P < 0.001), differed between the groups before matching (Supplementary Table 3).
After Matching
After matching, the differences in body weight (56.00 [50.00–65.00] vs. 56.50 [51.00–63.00] kg; P = 0.840) and BMI (21.21 [19.54–23.14] vs. 21.47 [19.33–23.73] kg/m2; P = 0.697) were balanced (Table 1). In initial status of the patients, difference in the ASA (P=0.478), SBP (114.0 [100.0–140.0] vs. 111.0 [100.0–133.0] mm Hg; P = 0.381), and presence of preoperative shock (32.94% vs. 37.65%; P = 0.630) were adjusted after matching (Table 2). In postoperative data section, vasopressors used in the ICU, NE days, initial NE dose, the highest NE dose, and application of RRT differed between the groups before matching (Supplementary Table 3). These parameters were adjusted after matching. However, some of the treatment outcomes, such as NE days (2.0 [2.0–3.0] vs. 4.5 [2.0–7.0] days; P = 0.013), average daily intake (3,122.80 [2,742.60–3,793.43] vs. 4,011.14 [3,358.75–4,766.67] ml; P < 0.001), average daily fluid balance (675.80 [332.20–829.14] vs. 1,600.50 [1,354.50–1,992.29] ml; P < 0.001), fSOFA at ICU discharge (2.0 [1.0–5.0] vs. 3 [2.0–5.0]; P = 0.038), and delta SOFA (–0.17 [–0.67 to 0.25] vs. 0.00 [–0.50 to 0.50]/day; P = 0.008) differed even after the matching process. Average daily urine output (1,877.0 [1,538.86–2,208.20] vs. 1,625.0 [1,237.86–2,098.14] ml; P = 0.060) was not statistically different between the groups after matching (Table 3).
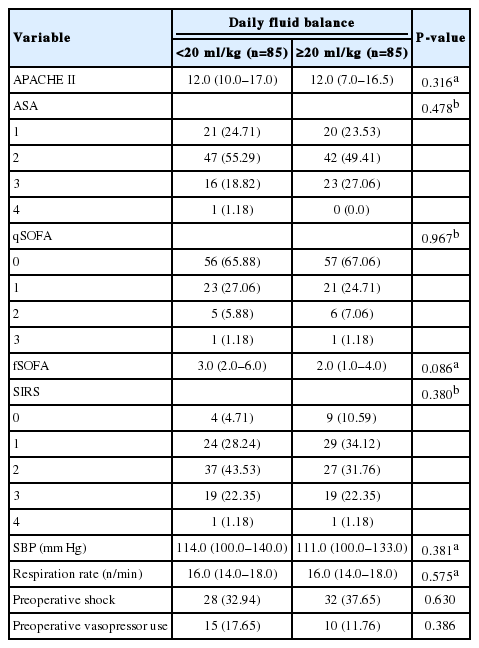
Initial status of the patients

Postoperative data
Clinical Outcomes
Before matching, ICU length of stay (2 [1–5] vs. 4 [1–13] days; P < 0.001) and MV days (0 [0–1] vs. 1 [0–9] days; P < 0.001) were shorter in the patients with daily fluid balance of less than 20 ml/kg. The in-hospital mortality (4.6% vs. 25.4%; P<0.001) and 30-day mortality (2.1% vs. 23.0%; P<0.001) were lower in these patients (Supplementary Table 4, Supplementary Figure 1). After matching, the 30-day mortality (2.4% vs. 11.8%; P= 0.036) was the only parameter to show better outcome (Table 4). The Kaplan-Meier survival curves also showed better survival in this group (log-rank test, P = 0.020) (Figure 2).
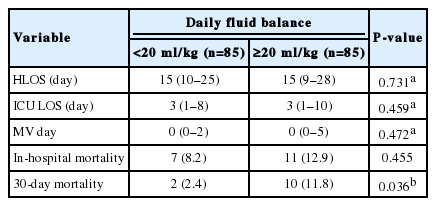
Clinical outcomes
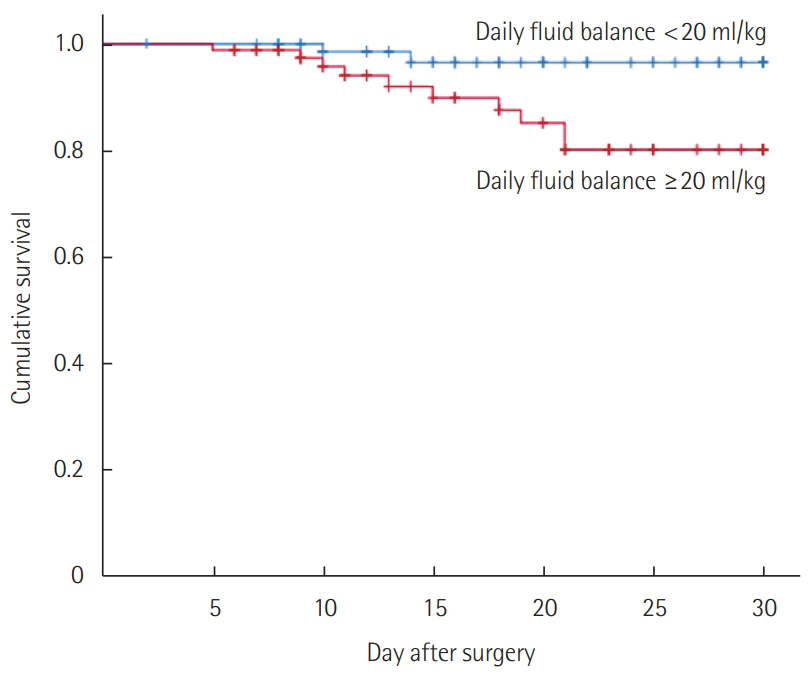
Kaplan-Meier survival curves for patients with different average daily fluid balance (after matching). The patients with an average daily fluid balance of <20 ml/kg showed a better survival curve during their hospital stay in the 30-day period than those who had an average daily fluid balance of ≥20 ml/kg (log-rank test, P=0.020).
According to the data after matching, proportion of patients with pre-existing pulmonary consolidation (4.7% vs. 11.8%; P=0.163) was not significantly different between the two groups but newly developed pulmonary consolidation during hospital stay (24.7% vs. 47.1%; P = 0.004) was lower in the patients who had daily fluid balance of less than 20 ml/kg. Rates of developing other complications showed no significant differences between the groups (Table 5).
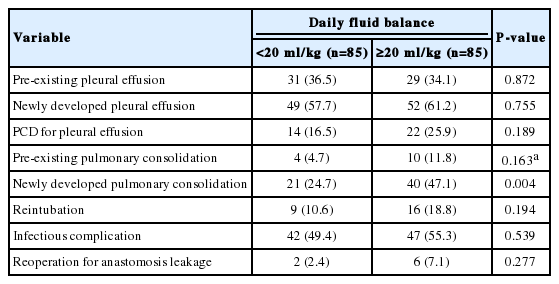
Complications
DISCUSSION
In our study, the postoperative patients with cIAI with a daily fluid overload of more than 20 ml/kg were associated with increased chances of developing lung consolidation and higher 30-day mortality. While fluid overload may cause severe complications in end organs and lead to multi-organ dysfunction, in a contemporary cohort of critically ill patients, initial fluid resuscitation is one of the core values in treatment [6,17]. To our knowledge, there are only a few studies to evaluate the association between fluid balance and critically ill postoperative patients with cIAI.
Fluid overload could have resulted either from increased fluid intake or decreased urine output; hence, the cause of the fluid gap between the groups had to be clarified. In other words, more severe patients with increased vascular permeability would require more fluid, and certain patients with acute kidney injury would produce less urine. Thus, the baseline characteristics and initial statuses of the two groups had to be balanced with PSM. After PSM, there was no statistical difference in the initial severity scores (APACHE II, ASA, SOFA score, initial NE dose), amount of urine output, and renal replacement rate between the two groups. Thus, it was reasonable to assume that positive fluid balance had not resulted from oliguria or severity of disease. The daily additional fluid intake in the group with higher fluid balance was 16.64 ml/kg more than that of the group with lower fluid balance. According to our data, fluid overload resulted from massive fluid administration.
The Surviving Sepsis Campaign 2016 recommended giving 30 ml/kg of initial fluid in bolus to resuscitate septic shock patients. It also recommended administering vasopressor only when the initial fluid resuscitation failed to maintain the mean arterial pressure at a level greater than 65 mm Hg [6]. However, the amount of fluid to be administered after initial resuscitation or emergency operation is still questionable.
Several studies reported that positive fluid balance was related to increased mortality [18-20]. Traditional signs of hypervolemia or volume overload are increased body weight, edema in extremities, pleural edema, pleural effusion, pulmonary rales, jugular venous distension, ascites, abnormal heart beat sounds, and inferior vena cava distension under sonographic evaluation [21-24]. Recently, bioelectrical impedance vector analysis for evaluation of volume status has been reported [25,26]. Other studies reported that the “early liberation, late conservation” strategy in fluid administration was related to the lowest mortality [27-29]. Meanwhile, adverse effects of fluid overload were reported in previous studies, which also reported that fluid overload may affect systemic organs, including the lung, kidney, brain, heart, gut, and extremities [30,31]. Although the newly developed pulmonary consolidation was the only significant complication observed, possibly owing to a short period of data collection, our study showed that fluid overload was associated with 30-day mortality.
As a retrospective study, our study dose not prove the causal relationship of positive fluid balance and volume overload with increased organ dysfunction and mortality. To overcome this limitation, PSM was applied to reduce the biases owing to the differences in the initial characteristics of our patient groups. However, certain patients required less fluid while they recovered from their initial statuses, which led to better outcomes. Besides, data were not collected for usage of diuretics and their amount, routes and amount of nutritional support, and volume of transfusion.
Despite the above limitations, this study suggests that prolonged liberal fluid therapy, which has been common in surgical patients, might cause adverse outcomes in critically ill surgical patients. As surgical intensivists, we aim to alert surgeon groups about our results that suggest a correlation between liberal fluid therapy and adverse outcomes in critically ill patients with cIAI. According to our data, it is essential to watch for excess fluid administration to reduce pulmonary consolidation and 30-day mortality.
In further studies, a prospective design of controlling fluid balance in postoperative patients would be necessary. Moreover, evaluating the outcome with early and aggressive application of RRT or diuretics in patients with inevitable fluid overload could be helpful for establishing a fluid management strategy. In conclusion, postoperative fluid overload with more than 20 ml/kg/day daily fluid balance was associated with higher mortality and newly developed pulmonary consolidation in critically ill patients with cIAI. Aiming for zero balance and reducing fluid administration after postoperative day 2 could be related to better patient outcomes with decreased mortality.
KEY MESSAGES
▪ Postoperative fluid overload may increase the risk of adverse events in critically ill patients.
▪ Average daily fluid balance of ≥ 20 ml/kg/day was associated with higher 30-day mortality, higher incidence of newly developed pulmonary consolidation in patients who underwent emergency gastrointestinal surgery for complicated intra-abdominal infection.
Notes
CONFLICT OF INTEREST No potential conflict of interest relevant to this article was reported.
Acknowledgements
The abstract was accepted and presented at the 32nd European Society of Intensive Care Medicine Annual Congress (ESICM LIVES 2019).
Notes
AUTHOR CONTRIBUTIONS
Conceptualization: YTJ. Data curation: YTJ, JS. Formal analysis: JS. Methodology, YTJ, JS, JYK. Visualization: JS, JYK. Writing–original draft: JS. Writing–review & editing: YTJ, JYK.
SUPPLEMENTARY MATERIALS
Supplementary materials can be found at https://doi.org/acc.2020.00031.
Baseline characteristics (before matching)
Initial status of the patients (before matching)
Postoperative data (before matching)
Clinical outcomes (before matching)
Complications (before matching)
Kaplan-Meier survival curves for patients with different average daily fluid balance (before matching). The patients with average daily fluid balance of <20 ml/kg showed a better survival curve during their hospital stay in the 30-day period than those who had average daily fluid balance of ≥20 (lowrank test, P<0.001).