Effect of a rapid response system on code rates and in-hospital mortality in medical wards
Article information

Abstract
Background
To determine the effects of implementing a rapid response system (RRS) on code rates and in-hospital mortality in medical wards.
Methods
This retrospective study included adult patients admitted to medical wards at Seoul National University Hospital between July 12, 2016 and March 12, 2018; the sample comprised 4,224 patients admitted 10 months before RRS implementation and 4,168 patients admitted 10 months following RRS implementation. Our RRS only worked during the daytime (7 AM to 7 PM) on weekdays. We compared code rates and in-hospital mortality rates between the preintervention and postintervention groups.
Results
There were 62.3 RRS activations per 1,000 admissions. The most common reasons for RRS activation were tachypnea or hypopnea (44%), hypoxia (31%), and tachycardia or bradycardia (21%). Code rates from medical wards during RRS operating times significantly decreased from 3.55 to 0.96 per 1,000 admissions (adjusted odds ratio [aOR], 0.29; 95% confidence interval [CI], 0.10 to 0.87; P=0.028) after RRS implementation. However, code rates from medical wards during RRS nonoperating times did not differ between the preintervention and postintervention groups (2.60 vs. 3.12 per 1,000 admissions; aOR, 1.23; 95% CI, 0.55 to 2.76; P=0.614). In-hospital mortality significantly decreased from 56.3 to 42.7 per 1,000 admissions after RRS implementation (aOR, 0.79; 95% CI, 0.64 to 0.97; P=0.024).
Conclusions
Implementation of an RRS was associated with significant reductions in code rates during RRS operating times and in-hospital mortality in medical wards.
INTRODUCTION
Rapid response system (RRS), also referred to as rapid response teams, medical emergency teams (METs), or critical care outreach programs, have been introduced to provide early intervention for patients with subjective or objective signs of unexpected clinical deterioration [1]. Compared to a traditional code team, an RRS proactively assesses hospitalized patients at risk for cardiac, respiratory, or neurologic deterioration, rather than patients who have already experienced cardiopulmonary arrest [2]. Such teams play important roles in the prevention of cardiopulmonary arrest and can improve patient outcomes [1,3].
Two previous meta-analyses published in 2007 [4] and 2010 [5] showed that implementation of RRS had no impact on rates of cardiopulmonary arrest. However, in recent years, nonrandomized, preintervention, and postintervention studies [6,7], as well as two meta-analyses [8,9] consistently showed reductions in rates of in-hospital mortality and cardiopulmonary arrest after RRS implementation. These findings have led to the establishment of RRS in many countries [1]. The implementation of RRS is increasing rapidly in South Korea as well because of the rapid response service pilot program started by the Korean Ministry of Health and Welfare, and Health Insurance Review and Assessment, in May 2019 [10]. Most previous studies focused on benefits of RRS implementation assessed in terms of hospital-wide code rates and mortality, which include both medical and surgical wards. Therefore, the current study was designed to determine the effects of RRS implementation on code rates and in-hospital mortality in medical wards alone.
MATERIALS AND METHODS
Study Design and Patients
This retrospective, longitudinal cohort study included adult patients (age ≥18 years) admitted to medical wards at Seoul National University Hospital, a 1,778-bed tertiary-care referral hospital in Seoul, South Korea, between July 12, 2016 and March 12, 2018. Patients who were not admitted to the Department of Internal Medicine were excluded (n=494). The medical wards in this study included four standard wards and one private ward, totaling 163 beds. During the study period, there were no other systemic changes in inpatient care at these wards (e.g., the introduction of a hospitalist system). The RRS was implemented in four standard wards on May 12, 2017, and in one private ward on August 2, 2017. We examined 4,224 patients who were admitted 10 months before RRS implementation and 4,168 patients who were admitted 10 months following RRS implementation in this study. This study was reviewed and approved by the Institutional Review Board of Seoul National University Hospital (IRB No. IRB-H-1804-069-937) and the requirement for informed consent was waived.
Rapid Response System
The RRS was first introduced in the children’s ward in hospital in September 2010, and was later expanded to 20 standard surgical wards in August 2015. As noted above, the RRS was implemented in four standard wards on May 12, 2017, and in one private ward on August 2, 2017. It was based primarily on the electronic medical record (EMR) screening system. Our RRS team comprised eight intensivists and three experienced nurses with more than 5 years of intensive care unit (ICU) experience. The RRS worked only during the daytime (7 AM to 7 PM) on weekdays. During RRS operating times, one intensivist and two nurses were responsible for RRS activations. RRS nurses performed primary screening and checks, and then called an RRS physician. RRS activation was defined when the RRS physician made a clinical decision for a patient. The criteria for the activation of RRS were typically based on acute changes of patient mental status, blood pressure, heart rate, respiratory rate, presence of hypoxemia, dyspnea, chest pain, paralysis, new-onset seizure, unexplained agitation for more than 10 minutes, color changes in the extremities, abnormal laboratory results, or worry on the part of the doctor or nurse (Table 1). Outcomes following RRS activation were divided into six categories: (1) consultation by an RRS physician (e.g., RRS physician advice regarding potential treatment options or plans), (2) transfer to ICU, (3) intervention by an RRS physician (e.g., RRS physician directly manages the patient), (4) intervention by an RRS nurse (e.g., lung suctioning and high/low flow oxygen titration, bi-level positive airway pressure application, or portable ventilator application), (5) accompanying patient to radiology, and (6) transfer to operating room.

Criteria for the activation of RRS
Study Outcomes and Data Collection
The primary outcomes were code rates per 1,000 admissions from medical wards during RRS operating times, and in-hospital mortality rates per 1,000 admissions in medical wards. The secondary outcomes were code rates per 1,000 admissions from medical wards during RRS nonoperating times, code rates per 1,000 admissions for the first 24 hours of unplanned ICU admission from medical wards, deaths after code, length of hospital stay, reasons cited for activating RRS, route of RRS activation, and outcomes following RRS activation. A code was defined as any patient with an unexpected cardiopulmonary arrest requiring activation of a hospital alert system and cardiopulmonary resuscitation, whereas in-hospital mortality was defined as death before hospital discharge.
All medical records were reviewed to obtain information regarding age, sex, vital signs at admission, date and time of code, return of spontaneous circulation, hospital survival, and total hospital admission days. The Modified Early Warning Score (MEWS) at admission was also calculated in both groups. MEWS of five or above were considered “critical scores” [11]. Data explaining the reasons for RRS activation, route of RRS activation, and outcomes after RRS activation were prospectively collected in our RRS cohort database and retrieved for the study.
Statistical Analysis
Categorical characteristics were summarized using frequencies and percentages, whereas continuous baseline characteristics were summarized as mean and standard deviation or median and interquartile range. Qualitative data were compared using the chi-square test with Yates’ correction. Normally distributed quantitative data were compared using Student t-test. If not normally distributed, quantitative data were compared using the Mann-Whitney U-test. Multivariable logistic regression analysis was used to assess the effects of RRS on code rates and in-hospital mortality in medical wards, by comparing patients in the pre- and postintervention groups. The odds ratios (ORs) and 95% confidence intervals (95% CIs) were estimated. All analyses were two-tailed and P-values less than 0.05 were considered to be statistically significant. IBM SPSS ver. 25.0 (IBM Corp., Armonk, NY, USA) was used for all statistical analyses.
RESULTS
During the study period, 8,392 patients were admitted to the medical wards. The baseline characteristics of patients are shown in Table 2. There were no significant differences in age, sex, or critical score of MEWS at admission between the preintervention and postintervention groups. During the 10-month period after RRS implementation in medical wards, there were 62.3 RRS activations per 1,000 admissions (Table 3). The most common reasons cited for activating RRS were hypopnea (≤8/min) or tachypnea (≥28/min), sudden stridor leading to the use of accessory muscles (43.8%), oxygen saturation lower or equal to 90% (30.8%), bradycardia (≤40/min) or tachycardia (≥130/min), symptomatic arrhythmia (20.8%), and hypotension (systolic blood pressure ≤80 mm Hg) or hypertension (systolic blood pressure ≥200 mm Hg; 20.0%). The most common route of RRS activation was an RRS member using an EMR-based RRS (88.8%), followed by nurses in medical wards (8.5%), and physicians in medical wards (2.7%). Among the patients for whom RRS was activated, 91 (35.7%) were treated with consultation by the RRS physician, 55 patients (21.5%) were transferred to the ICU, and 52 patients (20.4%) were treated with intervention by the RRS physician.
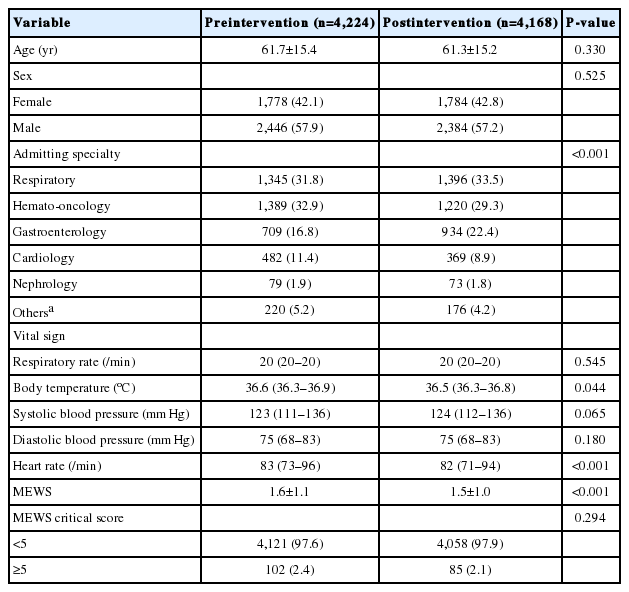
Baseline characteristics of the study sample

Clinical information and outcomes following RRS activation
After RRS implementation, code rates from medical wards during RRS operating times decreased significantly from 3.55 to 0.96 per 1,000 admissions (P=0.023), while code rates from medical wards during RRS nonoperating times did not differ between the preintervention and postintervention groups (2.60 vs. 3.12 per 1,000 admissions, P=0.813) (Table 4). In addition, total code rates from medical wards during the daytime on weekdays or off time, taken together, decreased from 6.16 to 4.08 per 1,000 admissions, but the difference was not statistically significant (P=0.250). The code rates for the first 24 hours of unplanned ICU admission from medical wards decreased significantly from 4.03 to 1.44 per 1,000 admissions (P=0.040). In-hospital mortality decreased significantly from 56.3 to 42.7 per 1,000 admissions (P=0.005), and hospital length of stay decreased significantly from 6.0 to 5.0 days (P<0.001). Monthly trends in code rates and in-hospital mortality in medical wards are shown in Figures 1 and 2. Deaths from medical ward codes did not significantly change after RRS implementation (P=0.840).

Summary of study outcomes before and after implementation of RRS
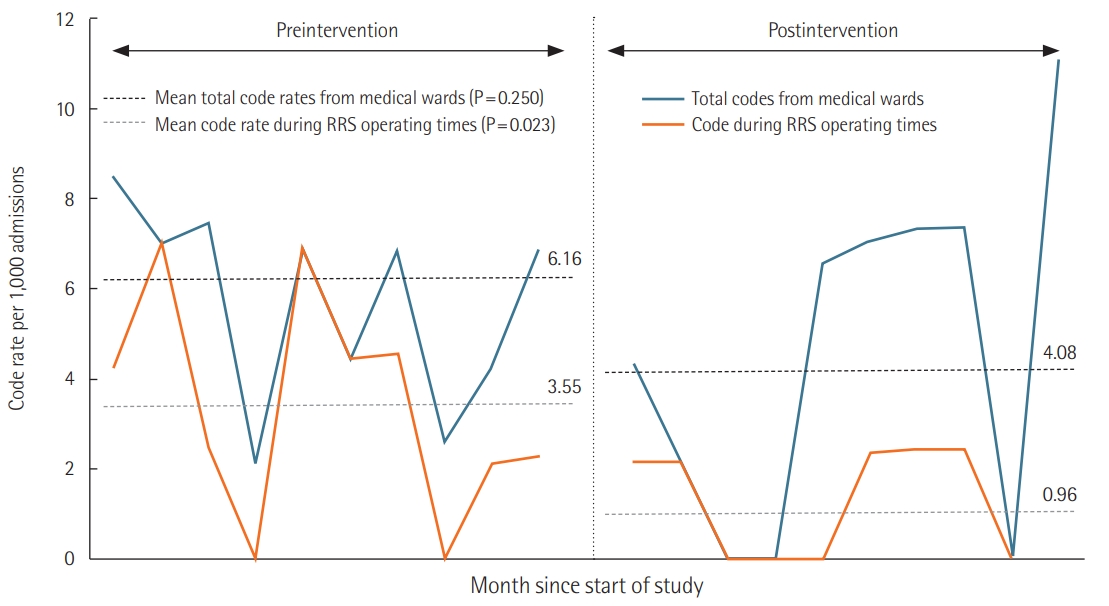
Monthly trends in code rates per 1,000 admissions.
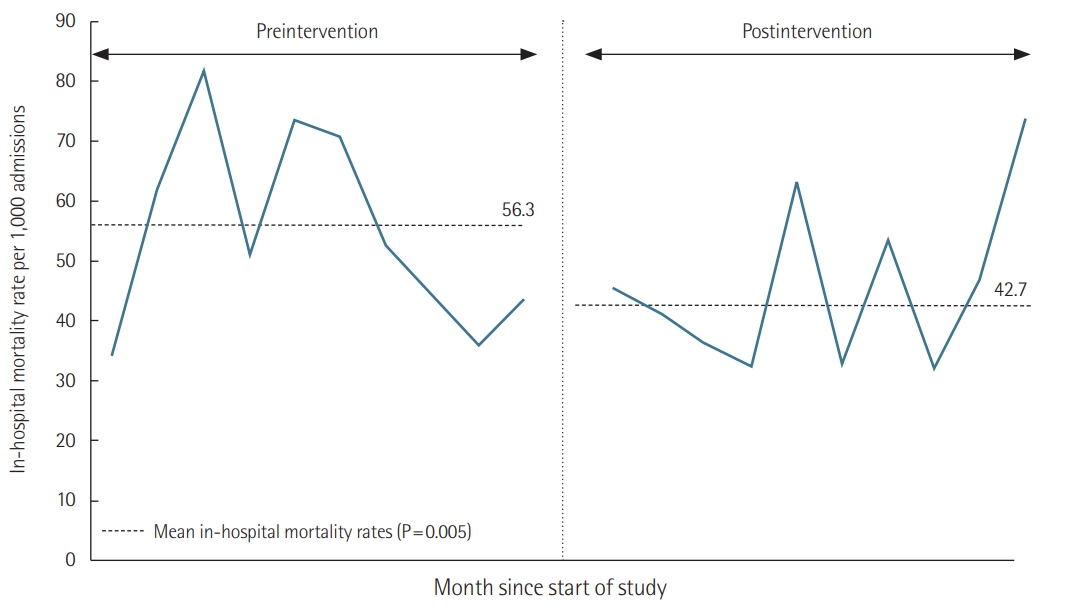
Monthly trends in in-hospital mortality per 1,000 admissions.
The logistic regression analysis, after adjustments for age, sex, admitting specialty, and critical score of MEWS at admission, revealed that implementation of the RRS was associated with a significant reduction in code rates from medical wards during RRS operating times (adjusted OR [aOR], 0.29; 95% CI, 0.10 to 0.87; P=0.028), but not associated with code rates from medical wards during RRS nonoperating times (aOR, 1.23; 95% CI, 0.55 to 2.76; P=0.614) (Table 5). In addition, implementation of the RRS was not associated with total code rates from medical wards (aOR, 0.70; 95% CI, 0.38 to 1.27; P=0.242). RRS implementation was associated with lower code rates for the first 24 hours of unplanned ICU admission from medical wards (aOR, 0.39; 95% CI, 0.15 to 0.99; P=0.047). The implementation of RRS was also associated with a significant reduction in in-hospital mortality (aOR, 0.79; 95% CI, 0.64 to 0.97; P=0.024).

Relationships between intervention of RRS, code rates, and in-hospital mortality
DISCUSSION
In this retrospective, longitudinal, pre- and postintervention cohort study, we found that the implementation of an RRS was associated with significant reductions in code rates during RRS operating times and in-hospital mortality in medical wards. However, there was no significant difference between groups in code rates during RRS nonoperating times.
The first multicenter, cluster-randomized trial of medical MET was the MERIT study, in which 23 Australian hospitals were randomized into two groups [12]. Twelve hospitals implemented the MET, and 11 hospitals continued to function as usual. The results of the MERIT study showed that the implementation of MET greatly increased emergency team calling but was not associated with reductions in unplanned ICU admissions, cardiac arrest, or unexpected death. In contrast, the results of the present study indicate that after RRS implementation, code rates from medical wards significantly decreased during operating times from 3.55 to 0.96 per 1,000 admissions (P=0.023). After adjustments for covariates, the implementation of RRS was associated with a significant reduction in code rates from medical wards during operating times (aOR, 0.29; 95% CI, 0.10 to 0.87). However, code rates from medical wards during nonoperating times did not differ between the preintervention and postintervention groups. This finding may reflect a unique positive effect of RRS implementation during operating times. Additionally, the implementation of RRS significantly decreased in-hospital mortality from 56.3 to 42.7 per 1,000 admissions (P=0.005). After adjustments for covariates, the implementation of RRS was associated with a significant reduction in in-hospital mortality (aOR, 0.79; 95% CI, 0.64 to 0.97). Among in-hospital deaths, there were no differences in the proportion of do-not-resuscitate (DNR) orders and proportion of deaths in the ICU between preintervention and postintervention groups (89.5% vs. 87.6%; P=0.664 and 33.6% vs. 34.3%; P=0.972). Our results were consistent with the results of two recent meta-analyses [8,9], wherein the implementation of RRS was associated with reductions in hospital mortality and cardiopulmonary arrest. Overall, our study and recent meta-analyses provide support for the 2015 American Heart Association guidelines’ update for cardiopulmonary resuscitation and emergency cardiovascular care, which state that RRS are effective for reducing the incidence of cardiopulmonary arrest, particularly in general care wards [3]. Further study is required to determine long-term effects of RRS implementation.
Previous studies showed that high response “doses” (>25 calls per 1,000 admissions) of RRS were associated with progressive reductions in cardiac arrest and in-hospital mortality [13,14]. Additionally, mature RRS that reported improvements of patient outcomes following RRS implementation had rapid response doses between 25.8 and 56.4 calls per 1,000 admissions [14]. In the present study, there were 62.3 RRS activations per 1,000 admissions. Therefore, our RRS delivered a sufficiently high response dose, which may explain the reductions of code rates during RRS operating times and in-hospital mortality in medical wards. Although the implementation of RRS did not significantly reduce total code rates from medical wards when including both operating and nonoperating times, code rates for the first 24 hours of unplanned ICU admission from medical wards significantly decreased from 4.03 to 1.44 per 1,000 admissions (P=0.040). These results imply that the effect of RRS is greater than simply helping to expedite transfers to the ICU, and that the implementation of an RRS prevents further clinical deterioration in the first 24 hours of unplanned ICU admission. Additionally, this hypothesis may account for reductions in in-hospital mortality in medical wards after RRS implementation. We are confident that high doses of RRS activation improve patient outcomes as indicated by our results.
In the present study, the most common reasons for activating RRS in medical wards were respiratory problems, including hypopnea or tachypnea, sudden stridor, and use of accessory muscles (43.8%), along with oxygen saturation lower or equal to 90% (30.8%). This finding is similar to those of a previous study, which reported that the most common reasons for activating RRS in medical wards were respiratory problems, including oxygenation (SaO2 <90% in room air or facial mask, O2 >8 L/min) (39.7%), respiratory rate <10/min or >30/min, accessory muscle use, and stridor (22.4%) [15]. We also found that among non-respiratory patients, the most common reasons for activating RRS in medical wards were still respiratory problems, including hypopnea or tachypnea, sudden stridor, use of accessory muscles (41.3%), and oxygen saturation lower or equal to 90% (27.1%), although the data are not shown here. Moreover, a previous study demonstrated significant differences in terms of triggers and causes of RRS activation between patients admitted to medical wards vs, surgical wards [16]. In that study, 75% of RRS activations in medical wards were triggered by respiratory problems, while sepsis, cardiac, and bleeding problems were the main reasons for RRS activation among patients admitted to surgical wards. Therefore, patients in medical wards require greater consideration for signs and symptoms of respiratory problems.
Our study has some limitations. First, this study was a singlecenter, retrospective study, and these findings reflect only a single tertiary-care referral hospital; therefore, the results may not be generalizable to other hospital settings. Additionally, the majority of patients in this study were respiratory (32.7%), hemato-oncology (31.1%), or gastroenterology (19.6%) patients. Different results may be observed in patients with other medical conditions. Second, data for respiratory rates at admission based on EMR could be incorrect. Third, we did not consider data for hopeless discharges or transfers to other hospitals, which could have affected our assessments of in-hospital mortality. Fourth, although there was no difference in the proportion of DNR deaths between preintervention and postintervention groups, DNR orders or withdrawal of life-sustaining treatment could have affected in-hospital mortality, because the practice of ordering DNR varies across hospitals and regions of the world. A previous study has reported wide variations in DNR rates (1%–37%) and DNR mortality rates (8%–60%) across hospitals. This observation implies that using locally-defined DNR as an additional covariate could potentially lead to systematic bias [17]. Fifth, since our study period was 20 months long, we may not have fully adjusted for seasonal variations. Finally, due to inaccuracies in the comorbidity data for our study population, we did not consider comorbidities in this study.
To conclude, the implementation of RRS in medical wards was associated with significant reductions in code rates during RRS operating times and in-hospital mortality in medical wards. Further, long-term postintervention follow-up studies are needed to confirm the effects of RRS implementation in medical wards.
HIGHLIGHTS
■ Rapid response system (RRS) facilitates early intervention for patients with unexpected clinical deterioration.
■ Implementation of an RRS in medical wards resulted in reductions of code rates during RRS operating times and in-hospital mortality.
Notes
CONFLICT OF INTEREST
No potential conflict of interest relevant to this article was reported.
AUTHOR CONTRIBUTIONS
Conceptualization: JC. Data curation: EY, SK. Formal analysis: HYL. Methodology: HJL, HL, SYO, EJH. Project administration: SML, SBK, HGR. Visualization: HYL. Writing - original draft: HYL. Writing - review & editing: JC, SML, JL.