The Role of Oliguria and the Absence of Fluid Administration and Balance Information in Illness Severity Scores
Article information

Abstract
Urinary examination has formed part of patient assessment since the earliest days of medicine. Current definitions of oliguria are essentially arbitrary, but duration and intensity of oliguria have been associated with an increased risk of mortality, and this risk is not completely attributable to the development of concomitant acute kidney injury (AKI) as defined by changes in serum creatinine concentration. The increased risk of death associated with the development of AKI itself may be modified by directly or indirectly by progressive fluid accumulation, due to reduced elimination and increased fluid administration. None of the currently extant major illness severity scoring systems or outcome prediction models use modern definitions of AKI or oliguria, or any values representative of fluid volumes variables. Even if a direct relationship with mortality is not observed, then it is possible that fluid balance or fluid volume variables mediate the relationship between illness severity and mortality in the renal and respiratory physiological domains. Fluid administration and fluid balance may then be an important, easily modifiable therapeutic target for future investigation. These relationships require exploration in large datasets before being prospectively validated in groups of critically ill patients from differing jurisdictions to improve prognostication and mortality prediction.
Introduction
Urinary examination has formed part of patient assessment since the earliest days of medicine. In Classical Greece, Hippocrates identified urinary characteristics and output as being of prognostic significance [1]. In the second century CE, Galen identified them as being a visible indicator of underlying renal function [2]. By the eighth century CE, as described in De urinis by Theophilus, urinary characteristics were being used as a diagnostic aid [3].
In general, the kidney has the ability to produce both very concentrated and very dilute urine to maintain water and electrolyte homeostasis. Fluid intake beyond that required for essential metabolic processes and those losses insensibly deemed “insensible” must be excreted. Fluid accumulation leading to an increasingly positive cumulative fluid balance may occur as a consequence of disordered elimination, as well as excessive administration (Figure 1). For patients in the intensive care unit (ICU), chronic disease, the presenting illness, intercurrent complication, evolving organ dysfunction, therapeutic administration and inadvertent coadministration of fluid, and the neurohormonal milieu of critical illness itself can make the maintenance of a normal fluid balance almost impossible. At one end of a continuum, oliguria may represent appropriate physiological attempts to conserve salt and water; at the other, it is an easily visualised manifestation of acute kidney injury (AKI).
Fluid accumulation in the critically ill. FBT: fluid bolus therapy; MFT: maintenance fluid therapy; AKI: acute kidney injury; CPB: cardiopulmonary bypass; ECMO: extracorporeal membrane oxygenation; CRRT: continuous renal replacement therapy; Postop: postoperative; ADH: antidiuretic hormone; CKD: chronic kidney disease; HRS: hepatorenal syndrome; CCF: chronic cardiac failure; PLE: protein losing enteropathy.
Historical Definitions of Oliguria
The modern interpretation of oliguria seems to arise from a series of papers published in the 1930s and 1940s [4]. During water privation studies, urine output (UO) would fall, and urine would become maximally concentrated with respect to urea, creatinine, phosphate, and other waste products at flow rates of less than 0.35–0.5 ml per minute [5-7]. Below this level, further reductions in UO were linearly associated with decreasing glomerular filtration rate [6,8,9]. While discussed clinically as a concept in educational papers in the early 1950’s [10-13], it wasn’t until the end of that decade that a definition of a total UO of <700 ml in 24 hours for oliguria, and <500 ml in 24 hours for severe oliguria, and <300 ml as a threshold for metabolic anuria were found in the literature [14-16]. Studies in the 1960’s continued to use absolute measures of UO as indicators of oliguria [17]. From the 1970s [18,19], 400 ml is quoted as the minimum volume of urine required to be produced over a 24-hour period (0.24 ml/kg/h) to clear the solute load of normal metabolism in a 70 kg man; 410 ml/24 h is used as the urinary definition of acute renal failure (ARF) in the Acute Physiology and Chronic Health Evaluation (APACHE) III classification system [20]. Even the most recent discussions of oliguria in critical illness often fail to discuss the derivation of the thresholds of UO defining the term [21].
Weight-based definitions of oliguria appear to arise in the paediatric setting before being translated to adults, though the transition is unclear in the literature [22,23]. Until recently, there was little evidence demonstrating an association between specific weight-based UO thresholds and outcome in children and neonates [24,25].
AKI and Intensity and Duration of Oliguria
UO can be a challenging variable to incorporate into research. Accuracy can be questioned given the normal bedside estimate using visual inspection. Patients may not have indwelling urinary catheters, and so only intermittent outputs may be available. UO may be recorded over a number of hours, rather than hourly, making identification and data handling from electronic sources challenging. It may also be subject to fluctuations as a result of changes in patient haemodynamics, vasoactive medication dosing, diuretic administration or other clinical event [26,27]. However, it remains an attractive marker of renal function, despite these limitations. It offers an apparent real time marker of renal function, allowing the natural history of renal dysfunction to be charted—this is of particular importance for the characterisation and calibration of biomarkers of AKI [28]. It requires no knowledge of baseline values to be calculated, unlike changes in serum creatinine (sCr), which is itself an imperfect marker of renal function [26,29].
In 2004, the first consensus definition of ARF was published, based on expert opinion following a meeting of the Acute Dialysis Quality Initiative (ADQI) group [26]. The Risk, Injury, Failure, Loss, End-Stage Renal Disease (RIFLE) classification proposed three categories of oliguria of increasing intensity and duration, in addition to sCr based definitions of severity (Table 1). These definitions remained consistent across the subsequent revisions of the consensus statements. These included the change in terminology to AKI; the addition of small, 25 μmol/L increases in sCr defining stage 1 AKI by the Acute Kidney Injury Network (AKIN) guidelines; and adjustments taking into account baseline creatinine in patients with chronic disease. The most recent classifications were published in 2013 in the Kidney Disease: Improving Global Outcomes (KDIGO) guidelines, and presented similar definitions of oliguria [30,31].

Intensity and severity of oliguria as defined by international guidelines examining acute renal failure and AKI
While the authors of the ADQI statement acknowledge the arbitrary nature of the weight- and time-based definitions they provide, two important characteristics of oliguria were first discussed: intensity and duration [26]. Intensity refers to the magnitude of the hourly UO, where the lower the volume, the more severe the oliguria. As UO is typically measured hourly, duration refers to the number of hours below the designated intensity threshold. However, in the years since the publication of the original threshold definitions, numerous publications have examined the association between various definitions of oliguria and the subsequent development of AKI.
In a retrospective multi-unit, single-center observational study of 14,524 adult critically ill patients in a US teaching hospital, 57% of whom developed AKI defined by changes in sCr (AKIsCr), an attempt was made to validate the urinary criteria of the AKIN definition of AKI [32]. Using complex regression analysis involving all possible combinations of sCr increase, UO threshold and oliguria duration, the adjusted mortality and area under the receiver operating curve (AUROC) analysis were presented as contour plots. Mortality was demonstrated to rapidly increase as UO decreased below a threshold of <0.5 ml/kg/h. Over periods of 5 hours or less with UOs of <0.3 ml/kg/h, intensity was particularly important, with risk of death increasing significantly with intensity and duration of oliguria [32].
In a post-hoc analysis of a prospective single-center observational study of 725 adult ICU patients in New Zealand, 21% postcardiac surgery and 7.7% with chronic kidney disease (CKD), 72% of patients developed KDIGO AKIsCr or as defined by UO criteria (AKIUO) [28]. The optimal UO threshold, collected over 6 hours, predicting a significantly increased risk of death or need for dialysis in this population, was demonstrated to be 0.3 ml/kg/h. In a complex analysis, the authors offer a time-dependent volume threshold for identifying the intensity of oliguria likely to be associated with subsequent sCr increase. However, their findings have not been prospectively validated in a suitable cohort, and AUROC for predicting death or dialysis does not significantly increase with increasing duration of oliguria defined in this fashion beyond 6 hours [28].
Duration of oliguria identifying a subsequent high risk of KDIGO AKIsCr were explored in a retrospective observational study of 390 adult ICU patients with septic shock, 54.4% requiring vasopressor support, 25.1% with KDIGO stage II + AKI and 8.5% requiring renal replacement therapy (RRT) by 96 hours. On regression analysis in this population, consecutive hours of oliguria, defined as a UO of <0.5 ml/kg/h independently associated with development of KDIGO stage II/III AKIsCr. The sensitivity fell with increasing duration of oliguria over 1-, 3-, and 5-hour periods, though the accuracy and positive predictive value increased [33].
In one of the most detailed examinations of UO thresholds, 2,160 adult ICU patients, 42.8% with KDIGO AKI and 10.4% requiring RRT, from 16 Finnish ICUs were prospectively recruited to the Finnish Acute Kidney Injury observational study [34]. In a post-hoc analysis, an independent association was demonstrated between oliguria of differing duration and intensity, where thresholds of <0.5 ml/kg/h, <0.3 ml/kg/h and <0.1 ml/kg/h were taken to represent mild, moderate and severe oliguria, and AKIsCr, after adjusting for age, sex, illness severity, vasoactive or diuretic use, and degree of fluid overload. A similar relationship was demonstrated between oliguria and 90-day mortality after similar adjustment [35].
Oliguria has also been investigated as a predictive biomarker of subsequent AKIsCr. In a prospective multinational observational study of 239 adult ICU patients, 33.5% with sepsis 22.5% developing RIFLE I or worse AKI, and 8.8% requiring RRT in ICU, oliguria was defined as a UO of <0.5 ml/kg/h. In patients without AKIsCr and periods of oliguria, the subsequent risk of AKIsCr in the next 24 hours was associated with oliguria of even a single hour’s duration. The optimal cutoff, maximising both sensitivity and specificity, was identified as 4 hours on AUROC analysis, though the positive predictive value was only 11%. However, as a screening test, periods of oliguria shorter than 12-hour duration were of limited utility, with likelihood ratios less than 10 for predicting development of AKIsCr over 24 hours [4].
While weight-based thresholds of <0.5 ml/kg/h, <0.3 ml/kg/h and <0.1 ml/kg/h been demonstrated to be of significance as regards the development of AKIsCr and predicting subsequent death, at no point has the ability of the empirically derived weight-adjusted thresholds to predict outcome been compared to absolute values of UO. In addition, the relationship between actual and ideal body weight in the calculation of these thresholds remains unexplored.
AKI and Mortality: Dependent on UO?
Many studies have demonstrated the increased risk of mortality associated with developing AKIsCr, a risk that increases in magnitude with the severity of the renal dysfunction, and which may persist for 1 or more years following ICU discharge in survivors [36,37]. However, this relationship is complex (Table 2) [38,39].
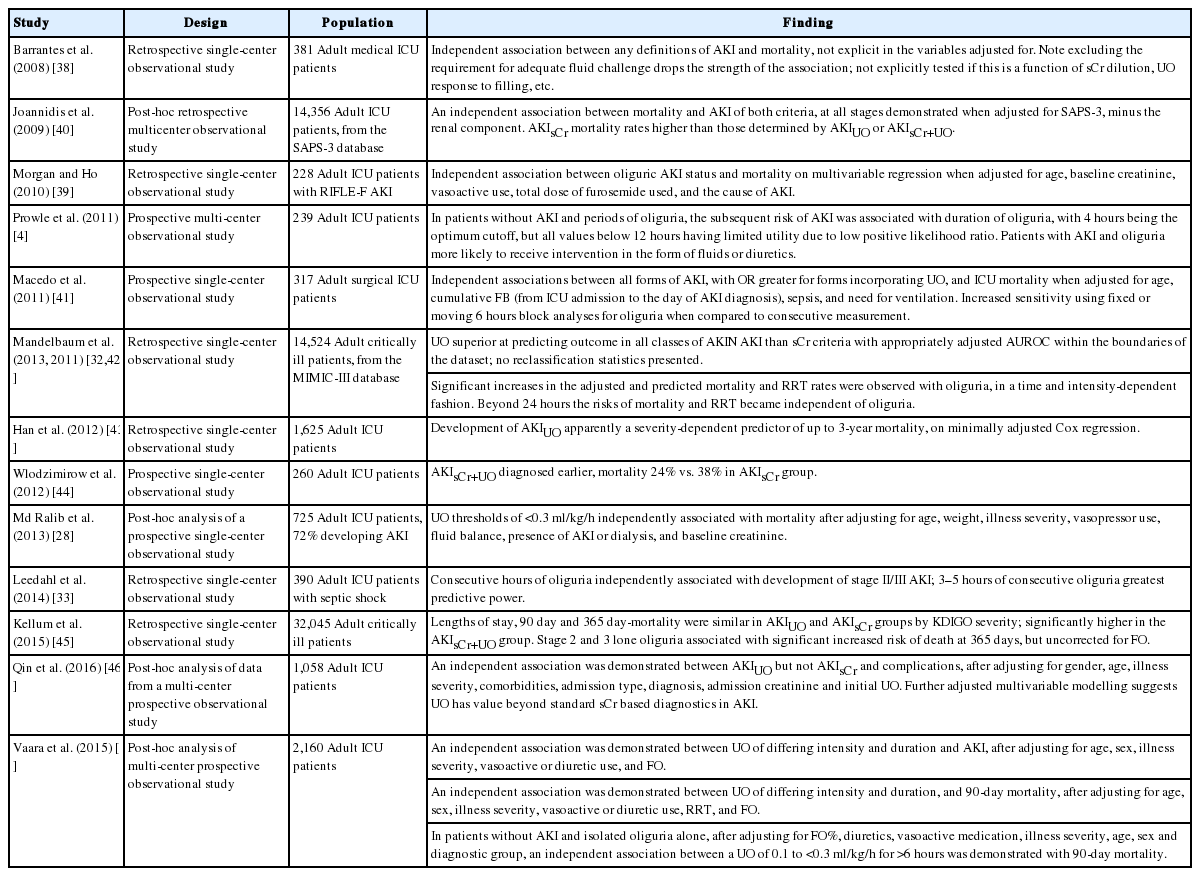
Studies exploring the relationships between AKI, UO, and mortality since 2008
The temporal and predictive relationships between UO, AKIN AKI and patient-centered outcomes were explored in a prospective single-center observational study of 317 adult surgical ICU patients from the United States, 10.7% with CKD. When divided into patients without AKI, with lone AKIsCr, lone AKIUO or AKI defined by both sCr and UO criteria (AKIsCr+UO), groups significantly differed by age, body mass index, presence of comorbidities, sepsis, hypotension, ventilation status, acid-base status and nephrotoxin exposure, with the AKIsCr+UO group having the highest number of those exposed. Fluid balance details were not presented. Independent associations were demonstrated between all definitions of AKI, irrespective of type, and ICU mortality when adjusted for age, cumulative fluid balance from ICU admission to the day of AKI diagnosis, sepsis, and need for ventilation, but not illness severity. Referent to patients without AKI, the odds ratio (OR) for mortality was higher in patients with AKIUO compared to AKIsCr (OR, 5.09 vs. 2.96), but highest in those with AKIsCr+UO (OR, 5.56) [41].
In a secondary analysis of 1,058 adult ICU patients, 55.4% developing AKI, 12.8% requiring RRT and, 4.8% with CKD from 22 Chinese centers, the additional and independent diagnostic and prognostic value of the KDIGO AKIUO over the AKIsCr criteria were assessed. Despite reporting changes in the incidence of AKI when using either UO and serum creatinine criteria AKIsCr+UO, no reclassification statistics were offered. KDIGO AKIsCr criteria could be applied across the entirety of the admission, not just the 7 days they are described and validated for. Oddly, patients requiring RRT were classified by UO or sCr changes, not as stage 3 AKI. An independent association was demonstrated between AKIUO (OR, 2.89; 95% confidence interval [CI], 1.96 to 4.25, P < 0.001), but not AKIsCr, (OR, 1.32; 95% CI, 0.9 to 1.94; P = 0.152), and hospital mortality, after adjusting for gender, age, illness severity, comorbidities, admission type, diagnosis, admission creatinine and initial UO, and complications, although the lack of reported collinearity between diagnoses raises methodological concerns. Further adjusted multivariable modelling suggests UO has value beyond standard sCr based diagnostics in AKI, but the magnitude seems out of keeping with the other literature [46].
In a prospective single-center observational study from a Dutch academic ICU, 260 adult ICU patients, 57% developing AKI, 6% with CKD, the effect of including UO criteria to sCr criteria on the incidence and time to diagnosis of AKI were explored. Cumulative fluid balance was higher in the RIFLE AKIsCr+UO group from AKI diagnosis; this difference was statistically significant over days 1–3 postdiagnosis. Fluid balance data was not used to adjust sCr, or in modelling. By day 7, RIFLE AKIsCr+UO was much more common than AKIsCr (80.8% vs. 41.5%), was diagnosed earlier and associated with a lower mortality (24% vs. 38%) [44].
In the study from New Zealand mentioned earlier, where sCr had been corrected for fluid balance, KDIGO AKI status by both UO and sCr criteria were identified: the incidence of KDIGO AKIsCr+UO was 72%, compared to 38% for AKIsCr alone. Referent to patients with no form of AKI, the odds of dying or requiring RRT were similar in the AKIsCr and AKIUO groups (OR, 1.34 vs. 1.36), but significantly higher in the AKIsCr+UO group (OR, 3.62).
In a retrospective single-center observational study from a US teaching hospital of 14,524 adult critically ill patients, 57% of who developed AKIN AKI, the ability of the sCr and UO AKIN criteria to predict morbidity and mortality were explored. UO criteria were superior at predicting outcome in all classes of AKIN AKI than sCr criteria with appropriately adjusted AUROC analysis within the boundaries of the dataset; however, no reclassification statistics were presented, which would probably have been the most appropriate method of comparing multivariable AUROC models [42].
The largest study to date explored the relationships between severity and duration of KDIGO AKIsCr, AKIUO, renal morbidity, and mortality in a large retrospective single-center observational study of 32,045 adult critically ill patients.
The mean fluid volume received over the first 24 hours varied significantly by KDIGO AKI status, with AKI-free patients receiving 3.8 ± 3.1 L; KDIGO AKIUO patients 4.1 ± 3.5 L; KDIGO AKIsCr patients 4.4 ± 3.9 L; and patients with KDIGO AKI by both sCr and UO criteria (AKIsCr+UO) received 5 ± 5 L of intravenous fluid, although sCr measurements were unadjusted for fluid balance. Patients with AKIsCr+UO were more likely to have sepsis and require vasopressors, those with AKIsCr had higher baseline sCr and CKD, and those with AKIUO more likely to have had major surgery. Lengths of stay, 90-day and 365-day mortality were similar in AKIsCr and AKIUO groups by KDIGO severity, but significantly higher in the AKIsCr+UO group [45].
Despite these convincing relationships between oliguria and mortality in the context of AKI, no study links urinary staging to sCr staging, nor explores the possibilities for “backwards classification”—using large datasets to identify patients with severe AKIsCr, RRT or death as a starting point, then determining the haemodynamic and demographic factors which would make associated proximate episodes of oliguria clinically significant. This information could lead to more robust definitions of AKIUO, or help define the phenotypes of clinically important types of AKI.
Fluid Accumulation: A Forgotten Mediator?
A standard clinical response to oliguria is the administration of additional intravenous fluid to correct true, relative or perceived hypovolaemia [47,48]. Moreover, routine maintenance and carrier fluid administrations may not be altered. However, it has never been determined if fluid accumulates in such circumstances because of treatment, or because of a failure of excretion, though it is likely to be a combination of both. Under these circumstances fluid accumulation could influence the relationship between AKI and mortality in many different ways (Figure 2) [49-51].

The complex relationship between acute kidney injury, fluid accumulation, and outcome. AKI: acute kidney injury; UO: urine output; sCr: serum creatinine; GFR: glomerular filtration rate; ΔFB: change in fluid balance.
There is an evolving stream of evidence from the critical care literature that fluid accumulation and fluid overload modify the relationship between AKI and mortality (Table 3). In a post-hoc analysis of data from the Program to Improve Care in Renal Disease study, 253 adult ICU patients developing AKI, 52% requiring RRT in ICU, 31% with CKD were identified with the aim of exploring the impact of fluid accumulation on the reported severity and time to diagnosis of AKIsCr. With increasingly positive median cumulative fluid balances and increasing percentage underestimation of sCr monitoring being reported over the first 7 days of ICU admission, 25% of patients had delayed recognition of RIFLE R+ AKI, but there was no significant increase in mortality following correction of sCr. Unfortunately, no net reclassification statistics were presented [53].
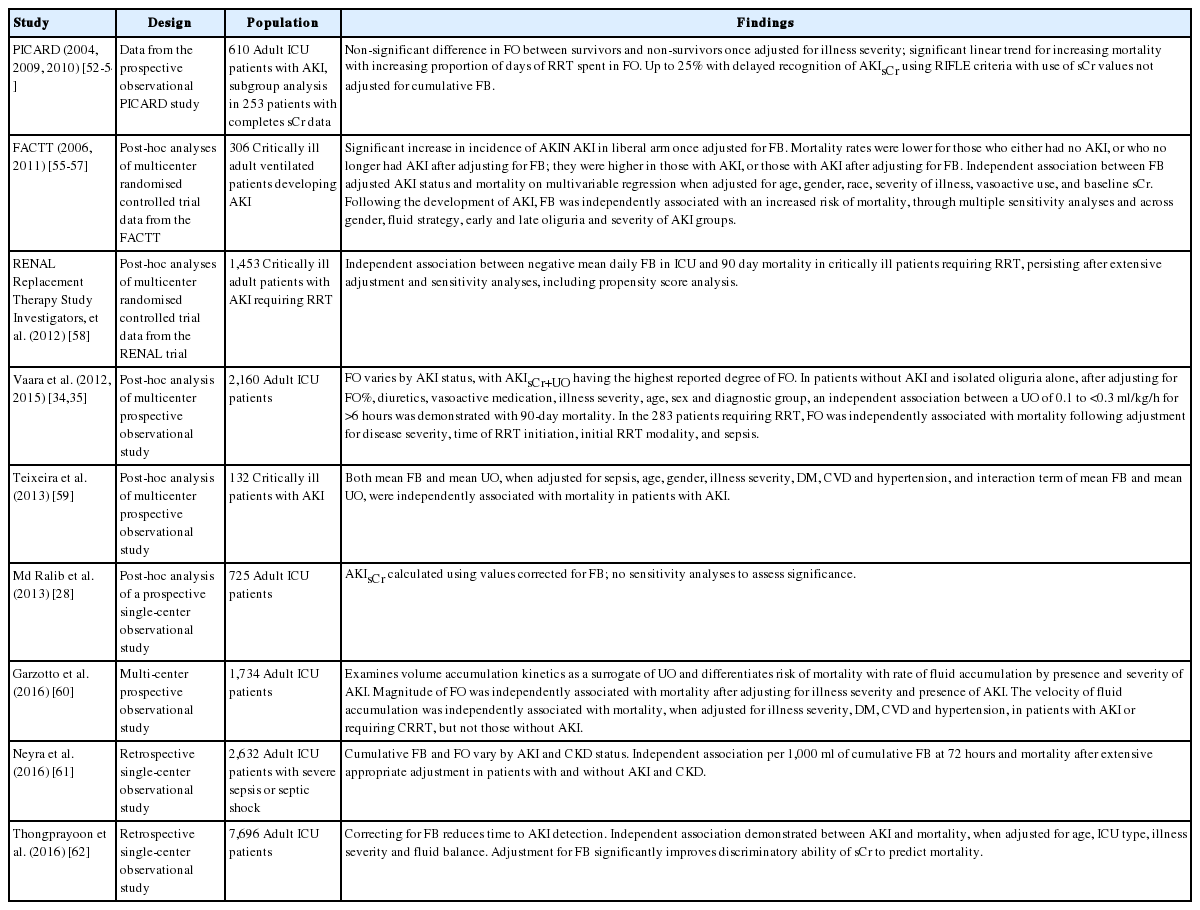
Studies exploring the relationships between AKI, oliguria, fluid balance, and mortality
In a post-hoc analysis of the North American Fluids and Catheters Treatment Trial (FACTT), 306 critically ill adult ventilated patients developing AKIN AKI within 48 hours of randomisation to pulmonary artery or central venous catheter and conservative/liberal fluid therapy were investigated to explore the relationships between fluid balance, diuretic therapy, and mortality. Conservative fluid therapy patients (n = 137) had lower albumin concentrations. They were also likely to have a day 7 cumulative fluid balance of –200 ml, compared to a +7,000 ml fluid balance in the fluid liberal group. The incidence of AKIsCr shifted from being higher in the conservative group (57% vs. 51%, P = 0.04) to higher in the liberal group (66% vs. 58%, P = 0.007) following correction for fluid balance. Mortality rates were lower for those who either had no AKIsCr, or who no longer had AKIsCr after adjusting for fluid balance; they were higher in those with AKIsCr, or those with AKIsCr after adjustment. An independent association was demonstrated between fluid balance-adjusted AKIsCr status and mortality on multivariable regression when adjusted for age, gender, race, illness severity, vasoactive medication use, and baseline sCr. Significant differences were demonstrated between groups in UOs and proportions of patients with oliguria [56].
The largest such study to date is a retrospective single-center observational study, also from the United States, in 7,696 adult ICU patients, 43% with AKI and 27% with CKD, performed with the aim of evaluating the effects of adjusting for fluid balance on the incidence and severity of KDIGO AKIsCr, and the association with mortality. The median cumulative fluid balance over admission in this is population was 2.3 ± 5.4 L. After correction for fluid balance, the incidence of AKIsCr significantly increased from 24.3% to 25.3% (P < 0.001). A similar relationship between 60-day mortality and AKIsCr diagnosis precorrection and postcorrection for fluid accumulation following adjustment for fluid balance, age, ICU type, and illness severity was demonstrated as in the FACTT cohort. The discriminatory power of sCr as a predictor of subsequent 60-day mortality in this cohort improved on adjustment for fluid balance, as demonstrated by a statistically significant increase in the AUROC from 0.68 to 0.7 (P = 0.001) [62].
It is unclear whether fluid balance is a confounder of the relationship between AKI and mortality, having a direct, independent relationship with both the risk of developing renal dysfunction and death, or whether it lies on the causal pathway and therefore acts as a mediator of this relationship. Fluid administration is a routine intervention in the face of oliguria, but with limited evidence of generating a successful physiological response. Fluid accumulation can lead to organ oedema. The kidney is an encapsulated organ. Increased tissue volume leads to increased resistance to venous return, with subsequent reductions in glomerular filtration rate, and potentially contributing to renal ischaemia in severe cases [63-66]. Oedema of other organ systems such as the brain, heart and lungs may directly, via reductions in cardiac output or oxygen delivery, or indirectly via neurohormonal cross talk, contribute to AKI; such pathophysiological changes may also have a direct impact on mortality [67,68]. By increasing total body water and circulating volume, fluid accumulation could dilute serial creatinine measurements, masking the true severity of the underlying renal dysfunction [53,62]. While these relationships are of interest in the prognostication and management of critically ill patients with AKI, there are larger implications given the methods we use to predict outcome at a cohort, unit and national level using illness severity scoring systems.
Illness Severity Scores
Illness severity scoring systems, used to predict the outcomes of groups of patients in the ICU, are one reason why the disciplines of intensive care medicine, epidemiology and statistics travel so well together. While not useful for individual patient prognostication or decisionmaking, they are very useful in predicting mortality at a cohort level, standardising patient groups for illness severity for the purposes of research, and standardising mortality rates reported by individual ICUs to allow for performance monitoring and benchmarking [69]. Three of the most commonly used such models include the Mortality Probability Model (MPM), Simplified Acute Physiology Score (SAPS), and the APACHE classification. All three of these models include renal characteristics in the form of sCr, urea or UO measurements, acknowledging their potential contribution to patient outcome. However, all do so in different ways (Table 4).
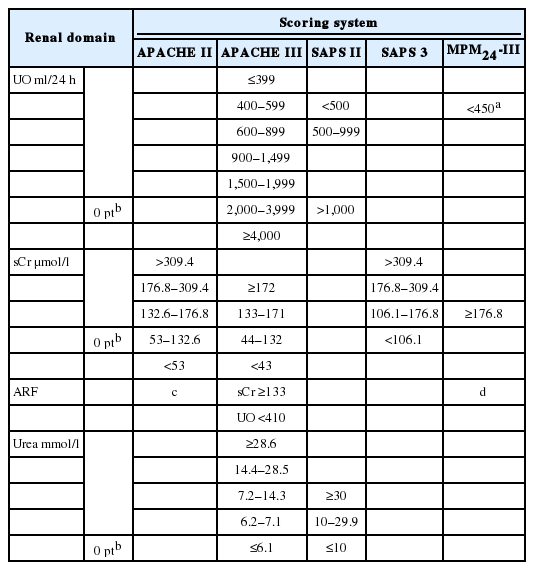
A summary of the renal domains of the major illness severity scores
Mortality Probability Model
The MPM is most commonly used in the US critical care literature [70]. Initially described in the 1980s using a single-center cohort, it has recently undergone its third iteration, this time based on a cohort of almost 125,000 patients from 135 ICUs in 98 centers in America [71]. As with the other models, its predictive performance has improved as it is has been serially derived from larger cohorts [72].
The MPM0 is generally based on parameters gathered on, or over the first hour of ICU admission, and so relies on preceding diagnoses and immediate physiology to predict subsequent ICU outcomes, although extended models taking into account physiological and clinical variables at 24 hours (MPM24), 48 hours (MPM48), and 72 hours (MPM72) also exist. Parameters are organised into categorical binary responses, offering little granularity. No studies have compared the MPM to other, routinely used models within the critically ill Australian and New Zealand (ANZ) population.
The renal component of the MPM0-III is based on the presence or absence of CKD, determined as sCr ≥176.8 µmol/l, or ARF, defined as a diagnosis of acute tubular necrosis or acute on chronic renal failure, but not acute prerenal failure (Table 4) [71]. The specifics of diagnosis are not referenced [71,73]. As MPM0 is calculated using only variables collected over the first hour of admission, it is unlikely to provide sufficient information to explore the relationships between fluid administration, fluid balance, UO, evolving AKI and mortality. The MPM24–72-II models incorporate postadmission variables over 24–72 hours, and include oliguria as a component, with a UO of <150 ml over 8 hours having an adjusted OR for death of 2.3 (95% CI, 1.9 to 2.7) [73]. No fluid administration or fluid balance variables were incorporated into the modelling during any of the three iterations, to our knowledge [71,73].
Simplified Acute Physiology Score
The SAPS was initially designed as a risk stratification tool as a weighted score based on expert opinion in a group of 679 patients from eight French ICUs [74]. Based on the worst value recorded in the first 24 hours of ICU admission in a collection of 14 variables, each scoring 0 to 4 points on the basis of magnitude of derangement, it was never designed to predict mortality. SAPS II, derived by logistic regression from over 13,000 patients from 137 ICUs from 12 countries in North America and Europe, incorporated acute physiology, surgical status, and chronic illnesses, but failed to account for the effect of acute diagnoses.
The renal component of SAPS 2, allocates points to derangements of serum urea concentration, and UO. In the SAPS 2 cohort, no relationship was demonstrated between mortality and sCr in the first 24 hours of ICU admission, or with the diagnosis of renal failure [75]. In general, SAPS II failed to calibrate to populations outside that from which it was derived [76].
Confusingly, SAPS 3 is a completely new model, specifically designed to identify at ICU admission, those at greatest risk of death, and the 20 component variables are collected over the first hour of ICU admission [77,78]. Prediction modelling was carried out in 16,784 patients from 303, mainly European, ICUs [78]. Though an international cohort, the North, Central and Southern American cohorts were small, and there was no evidence of significant participation by African or Asian centers [78]. Statistical modelling for the SAPS 3 cohort was complex; of potential renal variables only sCr is included (Table 4) [77]. Neither model incorporates measures of fluid accumulation, nor other fluid volume variables, nor is their evidence of their consideration for inclusion [75,77].
Acute Physiology and Chronic Health Evaluation
The APACHE classification system was first described in 1981, and was based on 700 patients from two ICUs in the United States [79]. The second iteration, APACHE II, followed in 1985, and was based on almost 6,000 patients from 13 ICUs in the United States [80]. The variables comprising both APACHE and APACHE II were selected and weighted by a panel of experts rather than logistic regression, an approach that followed in 1991 with the advent of APACHE III [20]. APACHE III was derived from extensive multiple logistic regression analysis in a cohort of 17,440 patients from 40 US ICUs. The 10th iteration of the APACHE III prediction model, APACHE III-j, was released into the public domain in 2002, and has formed the basis of mortality prediction for benchmarking and standardisation in ANZ until very recently [81,82].
Where APACHE II collects data on 17 variables, APACHE III requires more data collection, requiring information on 31. The APACHE scores capture patient status at the end of the first 24 hours in the ICU, with the worst value for each physiological variable being recorded over that time being assigned a weighted numerical value. Patients who were transferred from another site, who were readmissions, or spent less than 4 hours in the ICU were excluded from the derivation work. In the APACHE system, points are allocated to derangements of serum urea and sCr concentration, and UO, with additional weight provided for the diagnosis of ARF, in APACHE III defined as a sCr >133 µmol/l and a UO <410 ml over 24 hours. Such a diagnosis adds an additional 10 points to an APACHE III score beyond those accumulated for acute physiological derangement; each increase in APACHE III score of 5 points is associated with an increase in the OR for mortality of 1.1 to 1.78 (Table 4) [20,80]. Neither model incorporates measures of fluid accumulation.
The APACHE IV score is of significantly increased complexity, requiring the collection of more than 140 variables [83]. While routine collection of this data may be possible in systems with appropriate information technology infrastructure, the benefits of increased granularity are unlikely to outweigh the costs of collection.
ANZ Risk of Death Model
In ANZ patient data suitable for calculating several illness severity scores, including SAPS II, and APACHE II and III, are routinely collected as part of an ongoing peer review, quality assurance and clinical governance program facilitated by the ANZ Intensive Care Society Centre for Outcome and Resource Evaluation (ANZICS CORE) in the form of the adult patient database. The additional information that would have to be collected to generate the APACHE IV score means that it is unlikely be implemented in ANZ [84]. Moreover, APACHE-IV is poorly calibrated for use in the Asia-Pacific region [85-87].
The ANZ Risk of Death (ANZROD) model is a series of predictive equations utilizing components of the APACHE III-j acute physiology and age scores, along with chronic health variables (as defined by APACHE II), need for mechanical ventilation, the source of ICU and hospital admission, if admission was for elective surgery, presence of a treatment limitation order, lead time to ICU admission, and the effect of the primary diagnosis from a list of 124 which included regional diagnoses distinct from the APACHE III-j definitions [20,84]. Significant statistical interactions were observed between APACHE III score, acute physiological scoring and diagnosis, and so separate models were created for each diagnostic group—cardiovascular surgical, other cardiovascular, respiratory, gastrointestinal, neurological, trauma, sepsis, and other, giving eight separate equations, as well as a combined equation to represent the cohort [84]. While based on data from over 450,000 admissions between 2004 and 2009 [84], it was recalibrated with more than 100,000 further admissions per year from 2012, in part to further validate the model, and in part to offset the timedependent drift in predictive accuracy [69,82,88].
ANZROD was developed to be inclusive, and to be able to be applied to every adult patient—the only patients excluded were those admitted for palliative care or to facilitate organ donation [84]. It was based on the data already collected as part of an ongoing peer review, quality assurance and clinical governance program facilitated by ANZICS CORE [89]. Similar approaches building on established systems to develop locally relevant scores have been made in other jurisdictions [90].
The ANZROD effectively retains the renal components of APACHE III-j and data fluid administration and fluid balance variables are not used. Given that the AUROC for ANZROD in predicting hospital mortality is 0.902 in the ANZ population, it is likely to be a robust predictor of outcome in samples of patients from ANZ ICUs [69]. To improve on this already impressive predictive power would indicate that those variables had a strong independent association with mortality.
Fluid Volume Variables and Mortality
None of the currently extant major illness severity scoring systems or outcome prediction models use modern definitions of AKI or oliguria, or any values representative of fluid volumes variables. Moreover, none of the systems account for weight, or correct UO to the weightbased thresholds discussed above. It is uncertain if this is because they were examined at an early stage of the model building process and discarded, or if they failed to be considered at all. The second option is more likely given the notorious inaccuracy of pre-ICU fluid balance data, the original paradigms within which the models were constructed, the granularity of data available in large datasets, and the fact that large database cohort work is often done with patient groups already 3 to 5 years old, preventing immediate advances in information technology from being taken advantage of, while emphasising the temporal limitations of statistical prediction.
Indices of fluid administration and fluid balance are widely felt to be at least an indicator of illness severity, and may have an independent association with outcome [91,92]. Even if a direct relationship with mortality is not observed, then it is possible that fluid balance or fluid volume variables mediate the relationship between illness severity and mortality in the renal and respiratory physiological domains, or via the now anachronistic diagnosis of ARF [93,94]. This would make fluid administration and fluid balance an important, easily modifiable, potential therapeutic target for future investigation. The ANZROD offers a unique opportunity to explore the associations between illness severity, indices of renal function and fluid volume variables and mortality in critically ill patients in ANZ.
Conclusions
The current thresholds defining oliguria, while arbitrarily defined, have been demonstrated to have important relationships with the subsequent development of AKI and risk of mortality. However, studies relating absolute measurements, and measurements using ideal bodyweight to outcome are absent from the literature. The relationship between AKI and mortality is poorly explained by sCr alone, and it is likely that AKI syndromes presenting with oliguria represent both the least and most severe forms of renal dysfunction. Fluid accumulation appears to be an important mediator of the relationship between AKI, UO and mortality. Current illness severity scoring systems fail to take modern definitions of AKI and these complexities into account, and these relationships require exploration in large datasets before being prospectively validated in groups of critically ill patients from differing jurisdictions to improve prognostication and mortality prediction.
Notes
No potential conflict of interest relevant to this article was reported.
Acknowledgements
Avant Doctors-in-Training Research Scholarship supports Dr. Glassford. This review was supported by an unrestricted educational grant from the Austin Hospital Anaesthesia and Intensive Care Trust Fund.
Avant and the Austin Hospital Anaesthesia and Intensive Care Trust Fund played no role in preparation, review, or approval of the manuscript.
The authors would like to thank Dr. Johan Mårtensson and Dr. Suvi Vaara for their advice with the preparation of the final manuscript.