An algorithm to predict the need for invasive mechanical ventilation in hospitalized COVID-19 patients: the experience in Sao Paulo
Article information

Abstract
Background
We aimed to characterize patients hospitalized for coronavirus disease 2019 (COVID-19) and identify predictors of invasive mechanical ventilation (IMV).
Methods
We performed a retrospective cohort study in patients with COVID-19 admitted to a private network in Sao Paulo, Brazil from March to October 2020. Patients were compared in three subgroups: non-intensive care unit (ICU) admission (group A), ICU admission without receiving IMV (group B) and IMV requirement (group C). We developed logistic regression algorithm to identify predictors of IMV.
Results
We analyzed 1,650 patients, the median age was 53 years (42–65) and 986 patients (59.8%) were male. The median duration from symptom onset to hospital admission was 7 days (5–9) and the main comorbidities were hypertension (42.4%), diabetes (24.2%) and obesity (15.8%). We found differences among subgroups in laboratory values obtained at hospital admission. The predictors of IMV (odds ratio and 95% confidence interval [CI]) were male (1.81 [1.11–2.94], P=0.018), age (1.03 [1.02–1.05], P<0.001), obesity (2.56 [1.57–4.15], P<0.001), duration from symptom onset to admission (0.91 [0.85–0.98], P=0.011), arterial oxygen saturation (0.95 [0.92–0.99], P=0.012), C-reactive protein (1.005 [1.002–1.008], P<0.001), neutrophil-to-lymphocyte ratio (1.046 [1.005–1.089], P=0.029) and lactate dehydrogenase (1.005 [1.003–1.007], P<0.001). The area under the curve values were 0.860 (95% CI, 0.829–0.892) in the development cohort and 0.801 (95% CI, 0.733–0.870) in the validation cohort.
Conclusions
Patients had distinct clinical and laboratory parameters early in hospital admission. Our prediction model may enable focused care in patients at high risk of IMV.
INTRODUCTION
The Brazilian health system has been severely affected by the coronavirus disease 2019 (COVID-19) pandemic. As of February 2022, more than 26 million confirmed cases of COVID-19 infection and more than 630,000 deaths have been reported. In the city of Sao Paulo, over 1.0 million cases and 40,000 deaths have been reported.
The ongoing pandemic has overwhelmed health systems across the country and urged a better allocation of human and technical resources. In this context, simple approaches to understand the disease pattern and identify predictors of worse outcomes are needed. Early investigations reported that laboratory abnormalities have been associated with a greater mortality, including elevated ferritin, C-reactive protein (CRP), D-dimer levels and low lymphocyte count [1-4]. A recent meta-analysis demonstrated the importance of alterations in several biomarkers as a means of predicting mortality [5].
Despite the relevance of such derangements upon hospital admission as predictors of poor prognosis, there is scarce data addressing the impact of the trends of laboratory biomarkers on patient outcomes. Moreover, some of the predictive models available in the literature lack robustness, thereby limiting their clinical applicability [6]. Reliable information generated by such models would assist clinicians to stratify patient’s risk upon hospital admission and identify those most likely to require invasive therapies. Thus, we conducted a retrospective cohort to investigate patients hospitalized for COVID-19 in a private system in Sao Paulo, Brazil. Specifically, we described the population demographics and comorbidities, trends of laboratory tests and developed a model to predict the risk of mechanical ventilation.
MATERIALS AND METHODS
Study Design and Participants
This retrospective cohort study was conducted in a private network in Sao Paulo, Brazil (Hospital Sao Camilo) comprising three tertiary care hospitals (Pompeia, Santana, and Ipiranga Units). The study was performed according to the Helsinki Declaration, was approved by the local Ethics Committee of São Camilo Hospital and written informed consent was waived due to the use of retrospective deidentified data. We identified consecutive adult patients (aged ≥18 years) admitted to one of the three hospitals from March 5, 2020, to October 26, 2020 who were diagnosed with laboratory-confirmed COVID-19. Laboratory testing for severe acute respiratory syndrome coronavirus 2 (SARS-CoV-2) infection was performed using reverse transcription–polymerase chain reaction (RT-PCR) of nasopharyngeal or oropharyngeal swab sample. We excluded patients who did not have at least two sets of blood tests obtained during hospital stay, those whose symptom onset commenced more than 14 days prior to hospital admission and patients admitted for reasons other than respiratory infection.
Our institutional protocol underwent temporal modifications to incorporate evidence emerging from clinical trials. After the publication of Randomised Evaluation of COVID-19 Therapy (RECOVERY) study [7], corticosteroid was prescribed for all hospitalized patients requiring oxygen therapy. Hydroxychloroquine was administered as a compassionate therapy early in the pandemic for hospitalized patients and stopped being used after the publication of the Coalition Covid-19 Brazil I study [8]. Tocilizumab was administered for hypoxemic patients fulfilling the criteria for cytokine storm (elevated levels of CRP, ferritin, lactate dehydrogenase [LDH] and interleukin 6) in the absence of bacterial infection. Furthermore, oxygen was titrated to achieve an oxygen saturation between 88% and 92%. During the first month of the pandemic, neither non-invasive ventilation (NIV) nor high-flow nasal cannula (HFNC) was used due to guidelines reporting the risk of aerosol dispersion. Except for this period, the modalities of oxygen delivery comprised nasal cannula, non-rebreather mask, Venturi mask, NIV, HFNC, invasive mechanical ventilation (IMV) and venovenous extracorporeal membrane oxygenation.
Data Collection
For all patients, we collected data on baseline characteristics including demographics, comorbidities, peripheral oxygen saturation upon hospital admission, date of symptom onset, outcome (discharge, death or transfer) and dates of admission and discharge. In patients who required intensive care unit (ICU) admission, we also examined Simplified Acute Physiology Score (SAPS) III, intubation requirement, and dates of ICU admission and discharge.
Sequential Measurements of Laboratory Data
Laboratory data was extracted from electronic medical records. To minimize the influence of other issues complicating the initial COVID-19 infection in patients with a prolonged hospital stay, we limited the laboratory tests data collection timeframe to the first 14 days within hospital admission. Sequential serum laboratory values of the following parameters were obtained: CRP, LDH, D-dimer and creatinine levels; lymphocyte, neutrophil and platelet counts. We calculated two parameters: the neutrophil-to-lymphocyte ratio (NLR) was obtained by dividing the absolute neutrophil count by the absolute lymphocyte count, and lymphocyte-to-C-reactive protein ratio (LCR) was calculated by dividing lymphocyte count by the CRP level. Blood samples were usually obtained once daily. In cases of more than one test on a single day, the worst value was considered. In patients who required renal replacement therapy, we collected serum creatinine levels until the last measurement before the therapy commenced. Also, in patients who received tocilizumab, we obtained CRP levels up to the day when this therapy was administered.
To analyze patients across different severity groups, we split our study population into three subgroups: those who were not admitted to ICU (group A), those who were admitted to ICU but did not require IMV (group B), and those who required IMV (group C).
Statistical Analysis
Continuous variables were presented as means and standard deviations or median (interquartile range), as appropriate. Normal distribution of continuous variables was checked with the Kolmogorov-Smirnov test. Categorical variables were summarized as counts and percentages. No imputation was made for missing data. Chi-square test or Fisher exact test was used to compare categorical variables as appropriate. Kruskal-Wallis or Mann-Whitney rank sum test was used to compare non-parametric continuous variables and t-student test was used to compare parametric continuous variables.
To evaluate the efficacy of each serum biomarker in the prediction of mechanical ventilation, we calculated the area under the receiver operator characteristics (ROC) curve (AUC) for measurements obtained at hospital admission. For D-dimer and LDH levels, we observed a high frequency of missing values on day 1 attributed to logistic issues upon hospital admission. Therefore, we considered the worst value obtained from either day 1 or day 2.
A bidirectional stepwise logistic regression analysis was undertaken to determine the predictive factors for mechanical ventilation. We used 80% of our study population to develop the model and applied it to the remaining 20% to validate its performance. Variables that were significantly associated with the outcome in the univariate analysis were included in the multivariate model according to the following criteria: clinical relevance, lack of colinearity and missing data <15% of cases. Overall goodness of fit was verified by Akaike information criterion and discrimination of the model was evaluated by ROC curve of predicted probability. All statistical tests were two-tailed, and a P-value <0.05 was considered statistically significant. Statistical tests were performed using R version 4.0.2 (R Foundation, Vienna, Austria).
RESULTS
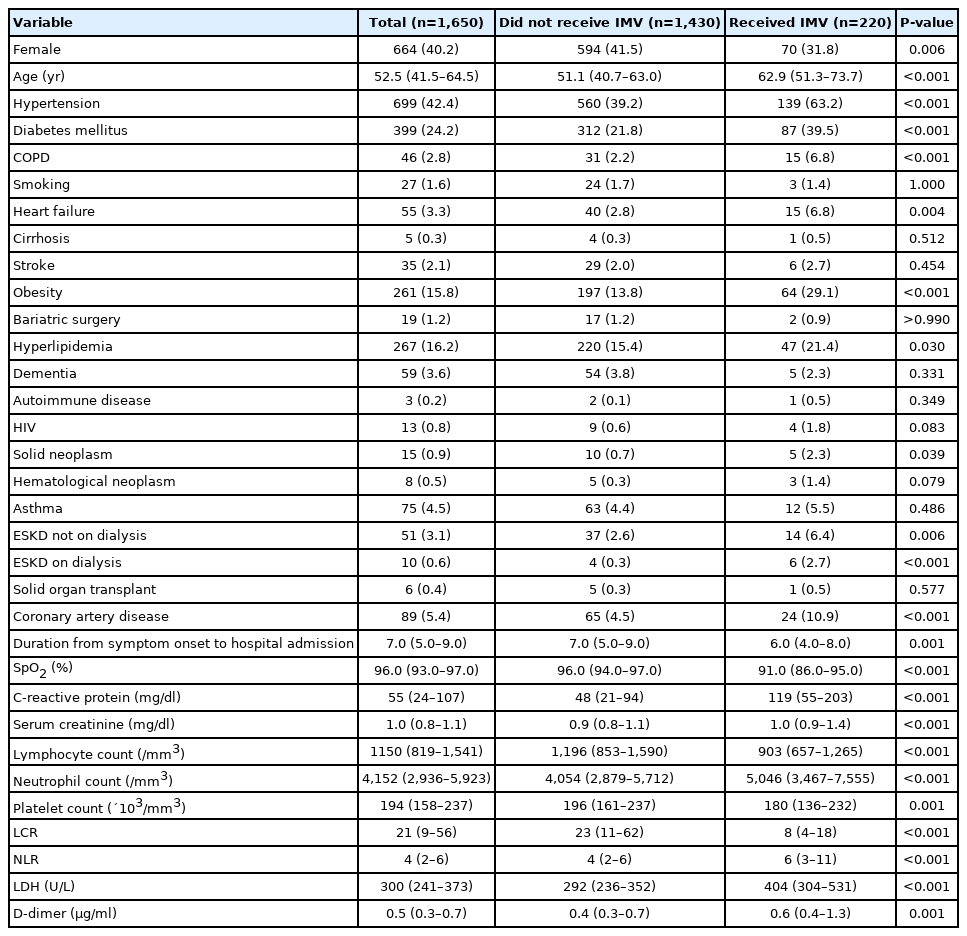
A total of 1,650 patients with a SARS-CoV-2 RT-PCR assay confirmed COVID-19 diagnosis were included in our study (Figure 1). The distribution of the outcome status along the first 14 days of hospitalization is illustrated in Figure 2. Table 1 demonstrates the demographic and clinical characteristics of the study patients. Overall, 986 patients (59.8%) were male and the median age was 53 years (range, 42–65). The median duration from symptom onset to hospital admission was 7 days (5–9). The most predominant comorbidities were hypertension (42.4%), diabetes (24.2%), hyperlipidemia (16.2%), and obesity (15.8%). A greater proportion of patients undergoing ICU admission were male in comparison to the population not admitted to ICU. Also, patients who became critically ill were older and had a lower oxygen saturation at hospital admission (Table 1). Acute respiratory failure was the reason for ICU admission in the majority of patients.
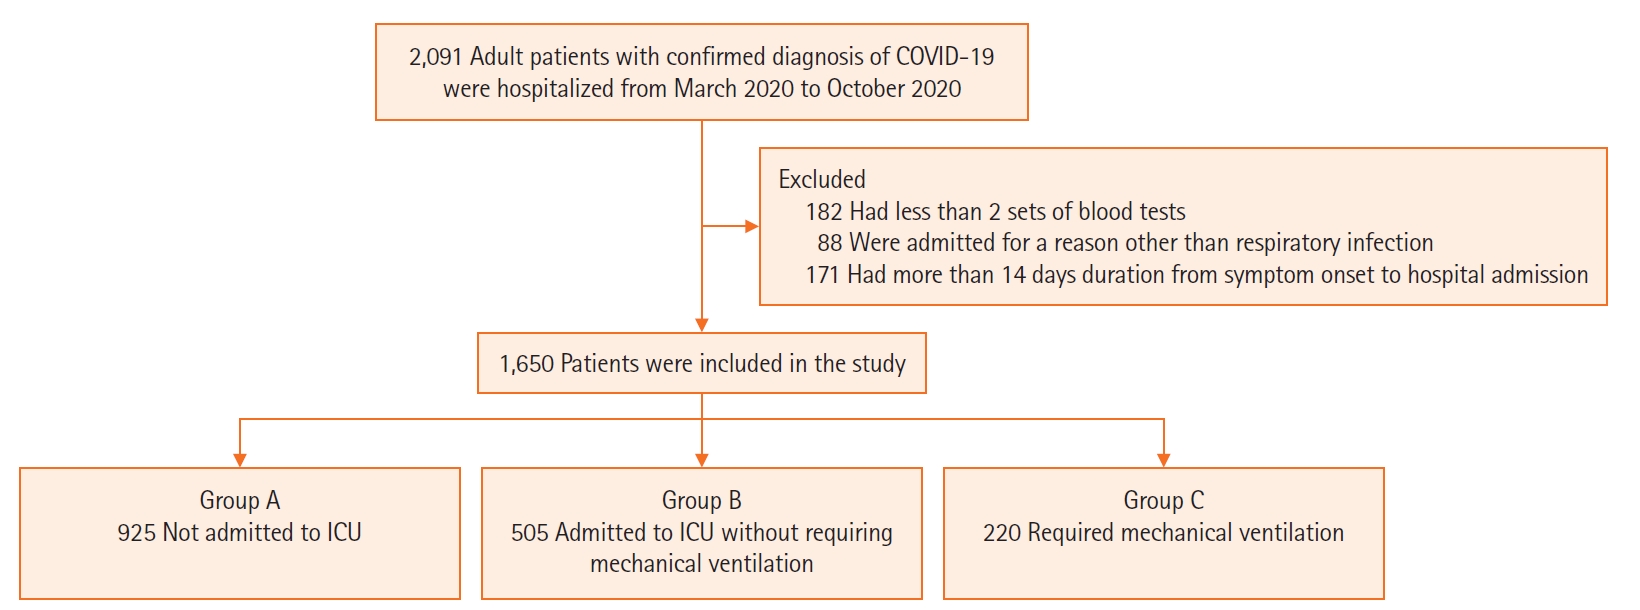
Flowchart of the study enrollment. COVID-19: coronavirus disease 2019; ICU: intensive care unit.
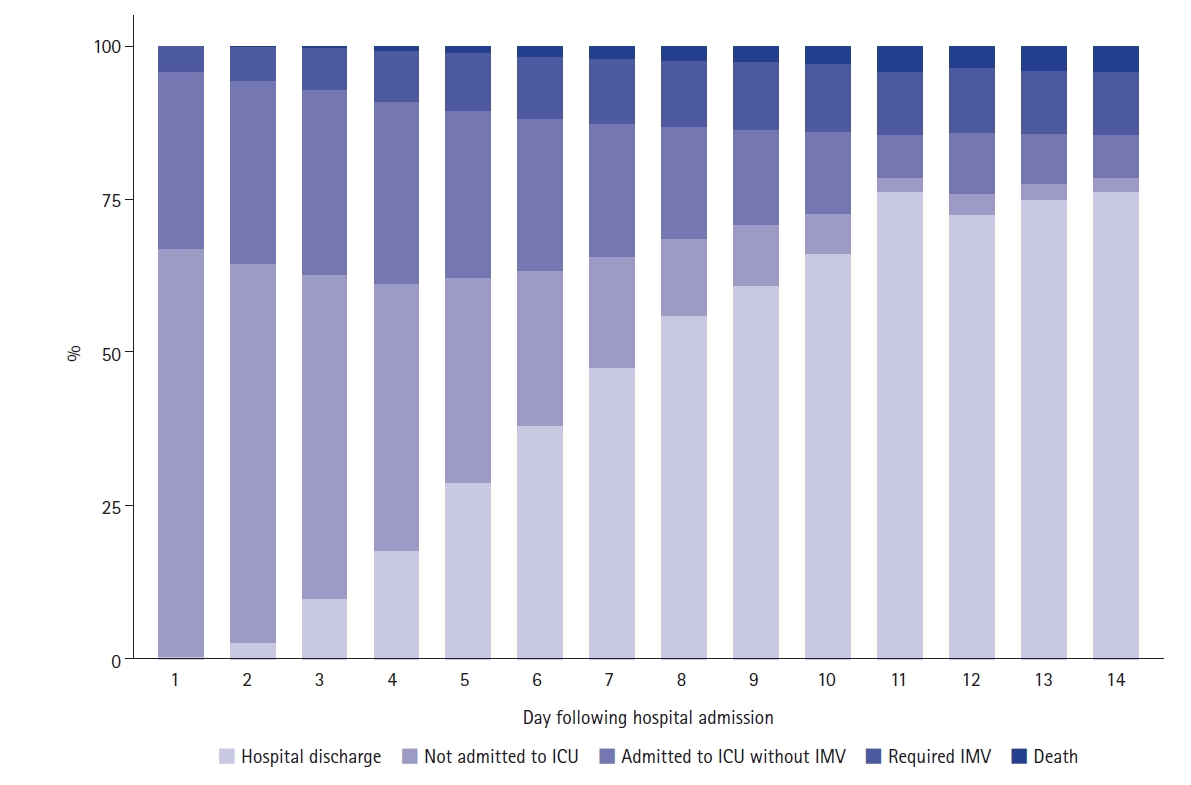
Daily distribution of study patients according to the outcome status. ICU: intensive care unit; IMV: invasive mechanical ventilation.

Baseline clinical characteristics of study patients
Measurements of laboratory biomarkers obtained at hospital admission are presented in Table 2. We found that such values differed among all subgroups. Furthermore, a two-by-two comparison between groups has also yielded statistically significant difference. Sequential measurements of the main laboratory biomarkers are represented in Figure 3. The median (interquartile range) hospital length of stay was 7 days (5–9) in group A, 10 days (8–15) in group B and 22 days (16–31) in group C. The number of patients who died during hospitalization was the following: 2 patients (<1%) in group A, 25 patients (4.9%) in group B and 102 patients (46.4%) in group C.

Measurements of laboratory biomarkers at hospital admission

Sequential measurements of laboratory biomarkers over the course of hospital stay. (A-H) Boxplots of values of laboratory biomarkers obtained during hospital stay. (A) C-reactive protein (CRP), (B) lactate dehydrogenase (LDH), (C) lymphocyte count, (D) neutrophil count, (E) platelet count, (F) D-dimer, (G) neutrophil-to-lymphocyte ratio (NLR), (H) lymphocyte-to-C-reactive protein ratio (LCR). Group A: patients who were not admitted to intensive care unit (ICU); Group B: patients who were admitted to ICU but did not require mechanical ventilation; Group C: patients who required mechanical ventilation.
To assess the performance of each laboratory biomarker in the prediction of mechanical ventilation, we plotted ROC curves of laboratory biomarkers obtained at hospital admission (Figure 4). We observed a better ability to predict the outcome with CRP, LDH and LCR levels. The following variables fulfilled the criteria in the univariate analysis in order to be included in the multivariate analysis (Table 3): age, sex, hypertension, diabetes, chronic obstructive pulmonary disease, heart failure, obesity, hyperlipidemia, solid neoplasm, duration from symptom onset to hospital admission, coronary artery disease, oxygen saturation, and laboratory biomarkers (CRP, NLR, platelet count, creatinine, D-dimer and LDH). Of these, a total of eight variables were selected as significant predictors for the requirement of mechanical ventilation: male sex, age, obesity, duration from symptom onset to hospital admission, oxygen saturation, CRP, NLR and LDH at hospital admission (Table 4). In the development cohort, the receiving operating characteristic curve was drawn with an AUC of 0.860 (95% confidence interval, 0.829–0.892) (Figure 5A) The performance of the model was internally validated and the AUC of the validation cohort was 0.801 (95% confidence interval, 0.733–0.870) (Figure 5B)

Receiver operating characteristic (ROC) curves for laboratory biomarkers obtained at hospital admission to predict requirement of mechanical ventilation. (A) C-reactive protein (CRP), lactate dehydrogenase (LDH), and D-dimer levels. (B) Lymphocyte, neutrophil, and platelet counts. (C) Neutrophyl-to-lymphocyte ratio (NLR) and lymphocyte-to-C-reactive protein ratio (LCR) values. AUC: area under the ROC curve; CI: confidence interval.
Univariate logistic regression analysis for predicting the requirement of mechanical ventilation in 1,650 patients hospitalized for COVID-19 in Sao Paulo, Brazil
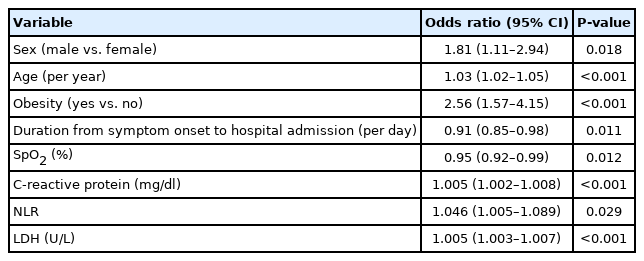
Multivariable logistic regression model for predicting the requirement of mechanical ventilation in 1,650 patients hospitalized for COVID-19 in Sao Paulo, Brazil
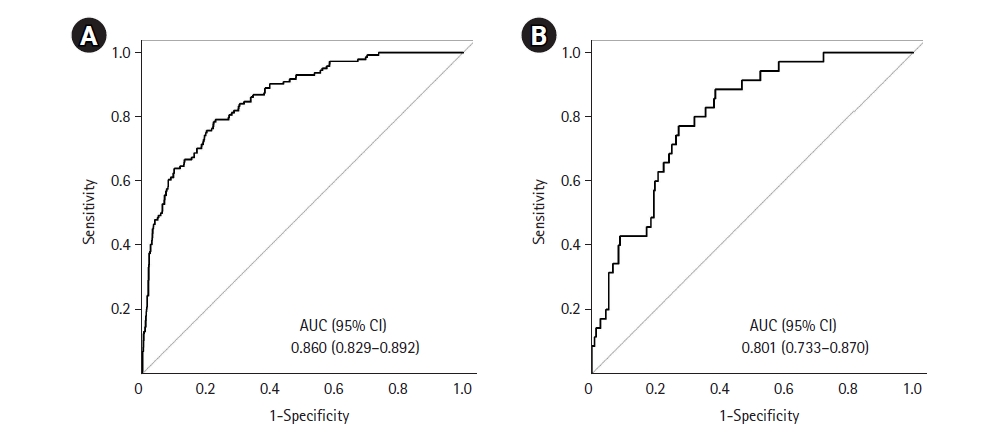
Receiver operating characteristic (ROC) curves for the multivariable logistic regression model to identify predictors of mechanical ventilation. (A) Development cohort. (B) Validation cohort. AUC: area under the ROC curve; CI: confidence interval.
DISCUSSION
We described the clinical characteristics of patients hospitalized for COVID-19 according to three subgroups (not admitted to ICU, admitted to ICU but not mechanically ventilated and admitted to ICU with requirement of mechanical ventilation). Also, we found that the main serum biomarkers differed among study subgroups. Furthermore, a good predictive performance was observed with CRP, LDH and LCR levels obtained at hospital admission. Finally, we built a logistic regression algorithm to identify predictors for the requirement of mechanical ventilation.
Our study supports the findings reported by other investigators with regards to the pattern of laboratory biomarkers derangements. Elevated CRP levels were associated with greater disease severity in observational cohorts [9-12]. Lymphopenia was commonly present in an early pandemic report [13] and was found to be linked to worse outcomes [3,14-16]. Studies have also documented the prognostic importance of elevated LDH on disease severity [17-19]. Furthermore, other studies reported critically ill patients had higher neutrophil count and D-dimer concentrations in comparison with mild cases [2,13,15,19,20].
A few studies have documented the variation of laboratory biomarker measurements during the course of the disease. In a cohort of 75 patients, Li et al. [21] observed that survivors had lower neutrophil, d-dimer and CRP levels and higher lymphocyte count at day 5 to 8 as compared to baseline. Other investigators found an early rise of CRP concentration during hospital stay, a finding that resembles the trajectory observed in our population [22,23]. In one study, patients who were critically ill, who died, or developed acute kidney injury had CRP levels significantly higher over time [23]. Furthermore, a retrospective cohort reported a similar trend towards greater levels of inflammatory biomarkers and lower lymphocyte count among patients who required a higher level of respiratory support or who died [24].
There are some similarities between predictors found in our algorithm and studies addressing pneumonia from non-COVID-19 cause [25,26]. Nevertheless, severity scoring systems validated for community acquired pneumonia, such as CURB-65 (6-point pneumonia severity score; 1 point for each of Confusion, Urea >7 mmol/L, respiratory rate >30/min, low systolic [<90 mm Hg] or diastolic [<60 mm Hg] blood pressure, age >65 years) [27] or PSI [28], address the mortality risk instead of the risk for IMV. Furthermore, they involve clinical findings not included in our algorithm such as altered mental status, hypotension, tachycardia and tachypnea, along with low oxygen saturation values and comorbidities. Also importantly, significant predictors in our model are not present in pneumonia severity scoring systems such as obesity, duration from symptom onset to hospital admission and serum levels of CRP and NLR at admission. Additional factors are implicated in the distinction between COVID-19 pneumonia from other causes of pneumonia. COVID-19 patients normally have more prolonged duration of mechanical ventilation and use of sedation, more profound hypoxemia, extensive use of prone positioning and higher risk of pulmonary embolism [29-31]. Moreover, the pandemic-related overcrowding may have compromised the usual level of care due to resource shortage [32].
Different predictive models have been developed in patients with COVID-19 to assist medical decision making [6]. Overall, studies reported a good predictive performance assessed by ROC curves, nevertheless, a wide range of predictors were evaluated and the outcome definition was not consistent across algorithms. In the CALL (comorbidity, age, lymphocyte, and LDH) score model, a multivariate Cox regression assessed factors associated with disease progression and identified age and LDH as significant predictors, variables that were also relevant in our model [33]. In another study using machine learning algorithms to predict severe outcomes, one of which was requirement of IMV, it was found that age, serum creatinine and CPR were significant predictors [34]. Furthermore, in a retrospective multicenter study performed in Michigan, an XGBoost algorithm was built to predict mechanical ventilation and the most important predictors were age and oxygen saturation [35]. In a multicenter investigation performed in Wuhan, a Machine Learning approach was implemented to predict severe disease [36]. Age was the most important feature, but the model also included CRP and LDH measurements. Notably, age and male sex were relevant predictors in other large multicenter cohorts, two of them were performed in South Korea [37-40]. Moreover, a retrospective study also in South Korea showed greater risk of disease severity with increased age and higher likelihood for critically ill symptoms in male patients [41]. Finally, a multicenter Italian study aiming to predict severe respiratory failure observed that age, obesity, creatinine and LDH were significant variables [42]. Importantly, we found that lower duration from symptom onset to hospital admission was a predictor of IMV requirement, a variable not commonly addressed by other investigators. Such inverse relationship between time from symptom onset and outcome was documented in a retrospective study assessing mortality [43].
Our study adds to the literature by providing data on epidemiological aspects, laboratory biomarker pattern and prognosis among patients hospitalized for COVID-19. Furthermore, Sao Paulo was one of the regions severely affected by the pandemic waves and faced an increased demand for ICU beds and shortage of medical equipment and healthcare staff. In addition, patients who require mechanical ventilation may not present with clinical signs of respiratory failure upon hospital admission, but frequently undergo rapid deterioration over the course of disease. Therefore, our findings may assist health systems to allocate resources and enable early intervention. On a patient level, those who are at high risk of receiving IMV may be considered to therapies demonstrated to shorten time to disease recovery. Moreover, our model seems to be feasible as the included parameters are widely available across different settings.
Our study has some limitations. Firstly, the retrospective nature of the study design may pose a greater risk of information bias as relevant clinical data may not have been well documented during the pandemic surge. However, our study subgroups were divided by unequivocal events (ICU admission and mechanical ventilation) and the model outcome was well defined (requirement of mechanical ventilation). Secondly, the timeframe of our data collection comprised different phases of the pandemic. As a result, patients may have been treated differently as initially clinical evidence was being accumulated and protocols were still under review. Nevertheless, the sample size was representative as we included a large number of consecutive patients admitted to our hospital network. Thirdly, we did not account for patients who had a do-not-intubate orders in place. As the evidence on disease prognosis were still being accrued in a such a complex and dynamic scenario, end of life decisions might have been affected and not consistently applied across the entire population. Finally, our model was developed and tested on patients from a single health system. Thus, future prospective studies implemented in different healthcare systems will provide external validity for our model.
Our study demonstrated that COVID-19 patients who developed worse outcomes had different epidemiological and laboratory biomarker characteristics accessible as early as at hospital admission. Also, our multivariable regression model showed good ability to predict the requirement of mechanical ventilation by including parameters widely available in clinical practice.
HIGHLIGHTS
▪ In our cohort hospitalized for coronavirus disease 2019 (COVID-19), we observed a good accuracy for mechanical ventilation prediction with some laboratory tests assessed at hospital admission including C-reactive protein and lactate dehydrogenase.
▪ Our algorithm identified in the multivariate analysis eight variables as significant predictors for mechanical ventilation: male sex, age, obesity, duration from symptom onset to hospital admission, oxygen saturation, C-reactive protein, neutrophil-to-lymphocyte ratio and lactate dehydrogenase all assessed at admission.
▪ Despite the existence of many predictive models in COVID-19, our algorithm adds novelty to the literature by including a simple but often neglected variable: duration from symptom onset to hospital admission.
Notes
CONFLICT OF INTEREST
No potential conflict of interest relevant to this article was reported.
FUNDING
None.
AUTHOR CONTRIBUTIONS
Conceptualization: ATM. Data curation: all authors. Formal analysis: all authors. Methodology: ATM. Project administration: ATM. Visualization: EAO. Writing–original draft: all authors. Writing–review & editing: all authors.
Acknowledgements
The authors express their appreciation for the statistical support provided by Ms. Luciana M Ishihara and for the data collection undertaken by the nursing team of Imed Group (Renata Melo, Selma Bezerra, Milena P Sanches and Mariana Pecoraro).