Predictive value of the negative inspiratory force index as a predictor of weaning success: a crosssectional study
Article information

Abstract
Background
Identifying when intubated patients are ready to be extubated remains challenging. The negative inspiratory force (NIF) is a recommended predictor of weaning success. However, little is known about the role of NIF in the weaning process for the Asian surgical intensive population, especially for the Vietnamese population. Here, we aimed to investigate the cutoff threshold and predictive value of the NIF index for predicting the success of ventilator weaning in Vietnamese surgical intensive care patients.
Methods
A cross-sectional study was conducted at the Surgical Intensive Care Unit of Viet Duc Hospital from October 2016 to August 2017. A total of 64 patients aged 16–70 years undergoing ventilatory support through an orotracheal tube satisfied the criteria for readiness to begin weaning. The correlation between the NIF index with outcomes of the weaning process was analyzed. Specificity (Sp), sensitivity (Se), positive predictive value (PPV), negative predictive value (NPV), receiver operating characteristic (ROC) curve, and area under the curve (AUC) were calculated.
Results
The success rate of the entire weaning process was 67.2% (43/64). The median NIF values were –26.0 cm H2O (interquartile range [IQR], –28.0 to –25.0) in the successful weaning group and –24.0 cm H2O (IQR, –25.0 to –23.0) in the weaning failure group (P<0.001). According to ROC analysis, an NIF value ≤–25 cm H2O predicted weaning success (AUC, 0.836) with 91% Se, 62% Sp, 83% PPV, and 77% NPV.
Conclusions
An NIF cutoff threshold ≤–25 cm H2O can be used as predictor of weaning success in Vietnamese surgical intensive care patients.
INTRODUCTION
Mechanical ventilation, which is a technically advanced form of respiratory support and lifesaving intervention, plays a crucial role in managing patients in intensive care units (ICUs) [1]. However, mechanical ventilation can cause ventilator-associated pneumonia and ventilator-induced lung injuries, including barotrauma and atelectrauma [2]. These undesirable adverse events might lead to increased treatment cost and mortality rate, particularly among patients under prolonged mechanical ventilation. Therefore, ventilator discontinuation should be considered as soon as the underlying conditions that lead to ventilatory support improve [2]. Approximately 20% of mechanically ventilated patients are unsuccessfully weaned in the first attempt and must be reintubated [3,4]. Extubation failure can make hospital and ICU length of stay longer as well as mortality rate higher [5].
Several predictors of weaning success, such as negative inspiratory force (NIF), can aid clinical decision-making regarding discontinuation of mechanical ventilation [4,6,7]. NIF, which is also known as maximum inspiratory pressure, indicates the maximal effort of inspiratory muscles during inhalation against an obstructed airway; thus, this index is used to assess respiratory muscle strength [6,8,9]. An NIF value less than –30 cm H2O is the criterion for starting the mechanical ventilator weaning process [2,10]. Although a large study conducted in Brazil demonstrated that NIF can be a good predictor of successful ventilator weaning for ICU patients, with a sensitivity (Se) of 93% and a specificity (Sp) of 95% [9], there have not been any studies to assess the role of NIF in the mechanical ventilator weaning process in the Vietnamese population specifically. The differences in the Vietnamese population receiving treatment at different Surgical ICUs throughout Vietnam are due to the differences in the indications of mechanical ventilation, duration of ventilation, and surgical interventions. To address this, the present study was conducted to evaluate the predictive values of NIF in ventilator weaning protocols consisting of both spontaneous breathing trial (SBT) and extubation stage in patients undergoing treatment at a surgical ICU in Vietnam.
MATERIALS AND METHODS
Design of the Study
A cross-sectional study was conducted at the Surgical ICU of Viet Duc University Hospital from October 2016 to August 2017. The inclusion criteria were patients (1) aged 16–70 years; (2) supported by mechanical ventilation through an orotracheal tube for over 48 hours and without previous ventilation weaning failure; (3) ventilated in the pressure support (PS) mode with settings of PS 7 cm H2O, positive end-expiratory pressure (PEEP) 5 cm H2O, and fraction of inspired oxygen (FiO2) 40% for 10 minutes; and (4) with respiratory rates < 35/ min and expiratory tidal volume > 5 ml/kg. Patients with severe brain trauma, defined as a Glasgow coma scale (GCS) score less than 8; progressive neuromuscular diseases; home ventilator-dependence; tracheostomy; or a history of cardiovascular diseases were excluded. The sample size was calculated using the formula for the cross-sectional study [11], and, based on a study by Thille et al. [12], the proportion of extubation success was 80%. With an absolute error of 10% and a type I error at 0.05, the minimum sample size was 61. Because our study subjects were under mechanical ventilation, consent obtaining directly from study participants was waived by the local Ethics Committee. However, written inform consent was obtained from all direct caregivers of study participants. The study was approved by the Ethics Committee of Hanoi Medical University (No. 199/QĐ-ĐHYHN).
The ventilator weaning process was performed when the patient’s condition satisfied the criteria for readiness to begin weaning. These criteria included the following factors: reversal of underlying disease causing mechanical ventilation; adequate mentation, defined as a GCS score of ≥ 9; axillary temperature of <38°C; hemoglobin ≥8 g/dl; heart rate <140 beats/min and systolic blood pressure 90–160 mm Hg with or without using vasopressors and inotropes at minimal doses; a ratio of partial pressure arterial oxygen; and fraction of inspired oxygen (partial pressure of oxygen [PaO2]/FiO2) ≥ 150 mm Hg with PEEP level ≤8 cm H2O and FiO2 ≤40% [9,13,14]. The weaning process involving two stages: SBT and extubation. NIF was directly measured from the GE CARESCAPE R860 ventilator with software version 10, SP04 5 minutes before SBT stage initiation. The maneuver was performed three times with a 3-minute interval between parameter explanations. The most negative value of NIF was chosen.
During the SBT stage, continuous positive airway pressure mode with settings of PEEP 5 cm H2O and FiO2 40% was performed for 30 minutes. Meanwhile, intolerance signs, including signs of respiratory failure and subjective indices, were monitored to evaluate the failure of SBT [13]. Failure of SBT was defined by the following intolerance signs: (1) presence of respiratory failure, such as tachypnea, tachycardia, hypertension, hypotension, hypoxemia or acidosis, arrhythmia; and (2) subjective indices, such as agitation or distress, depressed mental status, diaphoresis, and evidence of increasing efforts. Patients without any intolerance signs at the end of the SBT stage were considered to achieve a successful SBT. These patients were subsequently extubated and monitored throughout the 48 hours following extubation. The intolerance signs, which indicated failure of extubation, were assessed by the researchers, who are qualified intensivists, while monitoring the patients; reintubation or tracheostomy was performed for patients showing intolerance signs. Patients showing effective SBT and successful extubation were classified in the successful weaning group. In contrast, patients with SBT failure, reintubation, resumption of ventilatory support, or death within 48 hours post-extubation were classified as the weaning failure group [6,13].
Demographic and clinical characteristics of patients including age, sex, Acute Physiology and Chronic Health Evaluation (APACHE) II score, length of hospital stay, length of surgical ICU stay, and duration of mechanical ventilation, were recorded. APACHE II scores were assessed by physicians at the time of surgical ICU admission [15]. The duration of mechanical ventilation was calculated as the time from the first day of intubation and ventilator support until patients were extubated and liberated from ventilators.
Statistical Analysis
Statistical analyses were performed using IBM SPSS ver. 20.0 (IBM Corp., Armonk, NY, USA) and MedCalc 13.0.6. Continuous variables were presented as median (interquartile range [IQR] = lower quartile–upper quartile), while categorical were presented as percentages. Univariate analyses of the demographic and clinical variables were conducted to ensure the comparability of comparison groups, weaning success and failure, as well as to gain the precision of correlation between NIF index and outcomes of the weaning process. The MannWhitney U-test was used to compare continuous variables; the chi-square test was used for categorical variables. Receiver operating characteristic (ROC) curves were created to calculate the final area under the ROC curve (area under the curve [AUC]) values. After data entry, MedCalc yielded the Se and Sp, as well as selected the maximal Youden’s index (Se+Sp–1) for the optimal cutoff point. Se, Sp, positive predictive value (PPV), negative predictive value (NPV), positive likelihood ratio (PLR), and negative likelihood ratio (NLR) of NIF cutoff values in predicting success in the SBT stage and extubation stage were calculated. The likelihood ratio is among the best ways to evaluate and express diagnostic accuracy [16]. The likelihood ratio of any clinical finding is the probability of that finding in patients with disease divided by the probability of the same finding in patients without disease and, as such, may range from 0 to infinity [16]. Therefore, a test with a high PLR and a low NLR has a high diagnostic accuracy. A two-sided P-value less than 0.05 indicated statistical significance.
RESULTS
A total of 64 patients was included in the study, with the average age of 44.6 years (SD, 18.0) (Figure 1), with 20.3% considered elderly patients ( > 60 years). The ratio of males to females was approximately 2.8:1. The most common underlying conditions were central nervous injury (32%), which was mainly due to trauma, and gastrointestinal surgery (22%). Mediastinal abscess and submandibular space infection were documented in 9.4% of patients. Multiple trauma accounted for 20% of the patients in the study. In the SBT stage, 11 cases (17.2%) showed intolerance signs. The remaining 53 patients (82.8%) passed the SBT stage; 43 of these cases were extubated successfully. Thus, 43 (67.2%) of 64 patients achieved successful weaning, and 21 patients (32.8%) failed to discontinue mechanical ventilation. Death was not recorded in this study (data not shown).
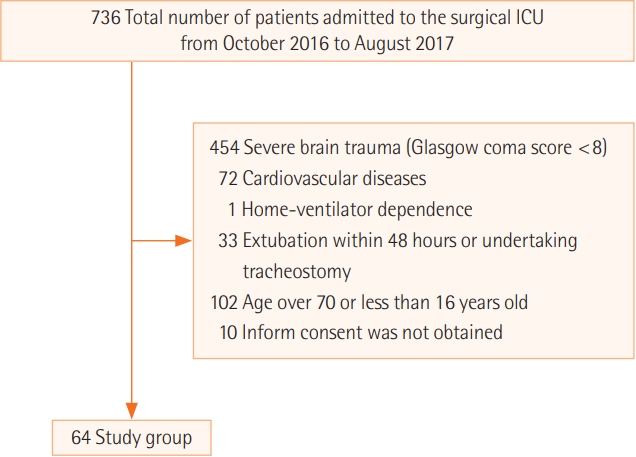
Flow diagram of study participants. ICU: intensive care unit.
There was no significant difference in the percentage of men between the weaning success group (72%) and the weaning failure group (76%). Similarly, there was no statistical difference in the median values of age (P = 0.143), length of hospital stay (P = 0.452) and surgical ICU stay (P = 0.307), APACHE II score (P = 0.351), and the duration of mechanical ventilation (the time from intubation to the time of the first SBT; P= 0.191) between the two groups (Table 1).

Demographic and clinical characteristics of 64 patients undergoing the mechanical ventilation weaning process
The Predictive Value of the NIF Index
There were significant differences in NIF values between the SBT success and failure groups, as well as between the extubation success and failure groups. The median values of NIF were –26.0 cm H2O in the SBT success group and –25.0 cm H2O in the SBT failure group (P < 0.001). Also, the difference in the median values of NIF between the extubation success group (–26.0 cm H2O) and the extubation failure group (–24.0 cm H2O) was significant (P = 0.005) (Table 2, Figure 2). The AUC of NIF in the SBT stage was 0.838 (Figure 3A). From the ROC curve, the optimal cutoff point of the NIF index was calculated as ≤ –25 cm H2O to predict the success of SBT with a Se of 83%, Sp of 73%, PPV of 94%, NPV of 47%, PLR of 3.07, and NLR of 0.23. In the extubation stage, the AUC of the NIF index was 0.781 (Figure 3B). The optimal cutoff point of the NIF was selected at ≤ –26 cm H2O to predict extubating success with a Se of 70%, Sp of 80%, PPV of 94%, NPV of 38%, PLR of 3.49, and NLR of 0.38.

Comparing NIF values between success and failure groups in the weaning process
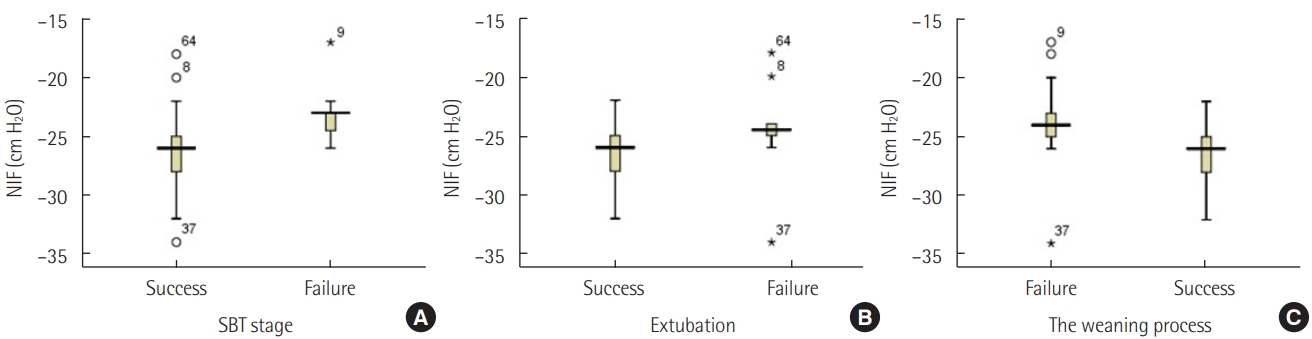
Box plot of change in negative inspiratory force (NIF) values between success and failure groups in the weaning process. (A) Spontaneous breathing trial (SBT) stage. (B) Extubation. (C) The weaning process.

Area under the receiver operating characteristic curve in the spontaneous breathing trial stage (A), extubation stage (B), and the entire ventilator weaning process (C). AUC: area under the curve.
The median NIF value of the successful weaning group including those who succeeded in both SBT and extubation was –26.0 cm H2O [IQR, –28.0 to –25.0], which was significantly more negative than the median value of –24.0 cm H2O [IQR, –25.0 to –23.0] in the weaning failure group (P < 0.001). The AUC and ROC curve of the NIF index in the entire process of liberating subjects from mechanical ventilation were also created. With the AUC of 0.836 (Figure 3C), the optimal cutoff value of the NIF was determined as ≤ –25 cm H2O with a Se of 91%, Sp of 62%, PPV of 83%, NPV of 77%, PLR of 2.39, and NLR of 0.15.
DISCUSSION
We found that the SBT success rate in our study was 82.8% (95% confidence interval [CI], 71.8%–90.1%) and the weaning failure rate was 32.8% (95% CI, 22.6%–45%). Patients who succeeded in the SBT stage had more negative NIF values than patients who failed to pass this stage (–26.0 cm H2O vs. –25.0 cm H2O, P < 0.001). In our study, the NIF value ≤ –25 cm H2O was selected to predict the SBT success with a Se of 83%), Sp of 73%, PPV of 94%, NPV of 47%, and an AUC of 0.838. In the extubation stage, the NIF median value of the successful extubation group was significantly more negative than that of the extubation failure group (–26.0 cm H2O vs. –24.0 cm H2O, P = 0.005). The NIF value ≤ –26 cm H2O was selected in our study as a threshold to predict the outcomes of extubation stage with the Se of 70%, Sp of 80%, PPV of 94%, and NPV of 38%.
The SBT success rate in our study was 82.8% (95% CI, 71.8%–90.1%) and was not different from the rate of 78.8% (95% CI, 76.1%–81.3%) reported by Godard et al. [17] or the success rate of 78.9% (95% CI, 77.3%–80.5%) reported by Boles et al. [6]. Similarly, the rate of weaning failure of 32.8% (95% CI, 22.6%–45%) documented in our study was not different from the rate of weaning failure at the first attempt of 31.2% (95% CI, 29.4%–33.1%) reported by Boles et al. [6]. Unlike other studies [6,18], our results suggest that the rates of SBT and weaning outcomes are not different between studies, regardless of the dissimilarities in baseline characteristics and underlying diseases of study participants though further studies may be needed.
Given SBT is the first step of the entire weaning process, the success of SBT is essential for ventilator discontinuation to proceed. Approximately 21% of patients who satisfy all criteria for weaning readiness fail the SBT stage [6]. Thus, indicators that assist clinicians in predicting the success rate of SBT may also enhance the success rate of weaning. The significant difference in the median NIF values between the SBT success group and SBT failure group in our study supports the role of the NIF index in predicting SBT success. Patients with a successful SBT stage had more negative NIF values than patients who failed to pass this stage (–26.0 cm H2O vs. –25.0 cm H2O, P < 0.001). Interestingly, to our knowledge, this association between the NIF index and SBT success has not been previously reported. In our study, the NIF value ≤–25 cm H2O was selected to predict the SBT success with an acceptable Se of 83% and Sp of 73% and an AUC of 0.838. However, the PPV of 94% and the NPV of 47% of this NIF cutoff point value reduce its clinical implication to predict SBT outcomes. Thus, it is recommended that this NIF cutoff point value should be used in combination with other predictors, such as the integrative weaning index and CORE (dynamic compliance, oxygenation, rate, effort) index, to evaluate the ability of patients to pass the SBT [19,20].
In the extubation stage, the NIF median value of the successful extubation group was significantly more negative than that of the extubation failure group (–26.0 cm H2O vs. –24.0 cm H2O, P = 0.005). This result supports the role of the NIF index as a predictor of extubation success, which is in line with the conclusion of Qing et al. [21]. However, Ko et al. [22] found that weaning parameters, including the NIF index, do not help predict outcomes of extubation in neurocritical care patients with medical illnesses such as hypertension and pneumonia.
An NIF value of ≤ –26 cm H2O was selected in our study as the threshold to predict the outcomes of extubation stage with the Se of 70%, Sp of 80%, PPV of 94%, and NPV of 38%. Meanwhile, Qing et al. [21] suggested a threshold of NIF index of –20 cm H2O with a Se of 78.2%, Sp of 71.4%, PPV of 95.5%, and NPV of 33.3%. The difference in the NIF cutoff points between the two studies may result from the variation of the study inclusion criteria. Qing et al. [21] gathered all simple-weaning, difficulty-weaning, and prolonged-weaning patients into one successful extubation group. However, in our study, patients with previous ventilation weaning failure were excluded, meaning that the successful group was comprised of only simpleweaning patients.
In our study, the significant difference in the median value of NIF between weaning success and failure groups supports a correlation between NIF index and weaning outcomes. Similarly, other studies noted that NIF values are significantly more negative in patients who achieve ventilator discontinuation in comparison with patients who fail the weaning process [9,23]. Nevertheless, Conti et al. [23] hypothesized that an NIF cutoff point < –16 cm H2O predicts the success of the weaning process with a Se of 95%, Sp of 42%, and diagnostic accuracy of 0.71 and concluded that this threshold was not useful for predicting outcomes of weaning in general ICU patients. The difference in NIF cutoff points between studies probably results from the distinction of underlying diseases leading patients to mechanical ventilation. Our study included only patients in a surgical ICU who mainly acquired central nervous injuries, trauma, and gastrointestinal surgeries and thus has overcome the limitation of the study conducted by Conti et al. [23], which is the diversity in underlying diseases of study participants. Based on our findings, we believe that the NIF index serves as a tool to evaluate the strength of respiratory muscles directly; therefore, it is likely a valuable predictor for weaning outcomes, minimizing the possibility of weaning failure [3,6,9,13].
Our research had some limitations. Firstly, the number of study participants in our study was quite small due to the limited research duration. However, our sample size was sufficient, and this sample size helped us observe patients more closely, especially for signs of irritation during weaning mechanical ventilation. Therefore, this helped us minimize potential measurement errors of the study and outcome factors. Secondly, using ventilators to measure NIF prevented us from comparing our results with other studies in which NIF was measured using manometers. Nevertheless, our method is suitable in limited resource settings where manometers are not available. Finally, we may have missed some baseline variables that may act as potential confounders in this study. In conclusion, the NIF index is a good predictor for the success of the SBT stage, the extubation stage, and the entire process of ventilator weaning. An NIF value ≤ –25 cm H2O could be used as a predictive threshold of weaning success in Vietnamese surgical intensive care patients.
KEY MESSAGES
▪ In this study, the optimal cutoff threshold of the negative inspiratory force (NIF) that predicts a successful weaning process was estimated among intubated patients receiving treatment at a surgical intensive care unit.
▪ An NIF ≤ –25 cm H2O predicts spontaneous breathing trial success, and an NIF ≤ –26 cm H2O predicts successful extubation.
Notes
CONFLICT OF INTEREST No potential conflict of interest relevant to this article was reported.
AUTHOR CONTRIBUTIONS
Conceptualization: PHV. Data curation: PHV, VDT. Formal analysis: PHV, VDT, MCD, QTC, TN. Methodology: PHV, VDT, MCD, QTC, TN. Project administration: PHV. Writing–original draft: PHV, VDT. Writing–review & editing: PHV, VDT, MCD, QTC, TN.