Abstract
-
Background
- Sepsis is a severe and common cause of admission to the intensive care unit (ICU). Radiomic analysis (RA) may predict organ failure and patient outcomes. The objective of this study was to assess a model of RA and to evaluate its performance in predicting in-ICU mortality and acute kidney injury (AKI) during abdominal sepsis.
-
Methods
- This single-center, retrospective study included patients admitted to the ICU for abdominal sepsis. To predict in-ICU mortality or AKI, elastic net regularized logistic regression and the random forest algorithm were used in a five-fold cross-validation set repeated 10 times.
-
Results
- Fifty-five patients were included. In-ICU mortality was 25.5%, and 76.4% of patients developed AKI. To predict in-ICU mortality, elastic net and random forest models, respectively, achieved areas under the curve (AUCs) of 0.48 (95% confidence interval [CI], 0.43–0.54) and 0.51 (95% CI, 0.46–0.57) and were not improved combined with Simplified Acute Physiology Score (SAPS) II. To predict AKI with RA, the AUC was 0.71 (95% CI, 0.66–0.77) for elastic net and 0.69 (95% CI, 0.64–0.74) for random forest, and these were improved combined with SAPS II, respectively; AUC of 0.94 (95% CI, 0.91–0.96) and 0.75 (95% CI, 0.70–0.80) for elastic net and random forest, respectively.
-
Conclusions
- This study suggests that RA has poor predictive performance for in-ICU mortality but good predictive performance for AKI in patients with abdominal sepsis. A secondary validation cohort is needed to confirm these results and the assessed model.
-
Keywords: acute kidney injury; computed tomography; image processing; intensive care unit; sepsis
INTRODUCTION
Sepsis is a frequent and severe condition, with a prevalence approaching 20% in intensive care unit (ICU) patients [1,2]. Sepsis mortality rates have dropped over time but remain unacceptably high. In a recent estimate in Australia and New Zealand, the 28-day mortality from sepsis in ICU patients was 17% [3]. Sepsis pathophysiology has been studied extensively during the past decade. Infections may cause complex and widespread inflammation resulting in both macrocirculatory and microcirculatory dysfunctions associated with organ failures that may eventually cause death [4]. In addition, venous congestion may also reduce organ perfusion and worsen organ failure [5,6]. To date, no specific treatment has demonstrated efficacy for sepsis. Acute kidney injury (AKI) is a frequent feature of sepsis and is consistently associated with worse outcomes [6]. Sepsis-associated AKI incidence varies between 22 and 53% [7]. Sepsis-associated AKI has long-term consequences. In this regard, AKI survivors may eventually develop chronic kidney disease with a substantial need for renal replacement therapy.
Radiomic analysis (RA) is a recent field of investigation in medical imaging. RA aims at using all the information existing in acquired medical images by extracting quantitative data using dedicated software. RA has been used in several domains to identify new predictors of clinical outcomes [8-10]. Radiomic data reflect tissue architecture and perfusion [9-12] and could therefore represent a valuable tool to predict organ failure or outcome during sepsis. The objective of this study was to assess and evaluate RA models for the prediction of in-ICU mortality and AKI occurrence in critically ill patients with abdominal sepsis.
MATERIALS AND METHODS
This preliminary single-center observational retrospective study received approval by an Ethics Committee (Comité d’éthique de la Recherche en Anesthésie-Réanimation, No. 00010254-2018-062) and Commission Nationale Informatique et Liberté (No. 173692) and a full waiver of informed consent was granted.
Study Design and Population
All medical records of patients admitted to the ICU between 2013 and 2016 were retrieved and further analyzed. Patients with the following criteria were included: (1) age >18 years, (2) history of severe abdominal sepsis during hospitalization, abdominal computed tomography (CT) with injection of iodinated contrast material and images acquired during the portal venous phase (i.e., 70 to 90 seconds after the beginning of intravenous administration of iodinated contrast material), and (3) CT examination was performed during the 48 hours preceding or following the diagnosis of sepsis.
Outcomes
The primary endpoint was in-ICU mortality. The secondary endpoint was AKI within 7 days after sepsis diagnosis.
Data Collection
The following data were collected from admission to discharge: (1) demographic data, (2) duration of hospitalization stay, clinical data (arterial blood pressure, pulse rate, pulse oxygen saturation, urine output, Glasgow coma scale, respiratory rate) and biological tests (blood count, blood and urine electrolyte tests, blood gas analyses, bacterial analysis), and (3) treatments administered during sepsis (mechanical ventilation, renal replacement therapy, antibiotics, vasopressors), in-ICU mortality, and timing of CT examination.
“Severe abdominal sepsis” was defined as an abdominal infection (i.e., confirmed by final diagnosis of abdominal infection in medical records or imaging with abnormal abdominal findings or surgical or endoscopic intervention confirming the diagnosis) and sepsis according to the sepsis 3.0 definition (i.e., variation of Sequential Organ Failure Assessment (SOFA) score before and after sepsis >2, and a suspected infection as fever or biological inflammatory syndrome or culture of bacteria) [13]. Patients were initially extracted using diagnostic code (CIM10: A41.9). Then, patients were reclassified using the sepsis 3.0 definition. Septic shock was defined as sepsis associated with hyperlactatemia ≥2 mmol/L and vasopressor therapy. Ischemic colitis caused sepsis or a sepsis-like inflammatory syndrome and was confirmed during a surgical procedure.
CT examination was performed within 48 hours before or after diagnosis of severe abdominal sepsis. AKI was diagnosed within 7 days of sepsis diagnosis. Simplified Acute Physiology Score (SAPS) II was assessed 24 hours after sepsis diagnosis. AKI was defined according to the Kidney Disease Improving Global Outcomes (KDIGO) criteria during the first seven days following abdominal sepsis diagnosis [14] using serum creatinine level and urine output as functional parameters. Mortality was defined as in-ICU mortality following a sepsis diagnosis until discharge from the ICU.
Patient Management
Patients were treated according to Hôpital Lariboisière Surgical ICU protocols in compliance with international guidelines. Antibiotics were administrated as soon as possible after sepsis was diagnosed and were chosen according to the local microbiological environment and local protocols. Surgical treatment was discussed with the surgeon, intensivist, and anesthesiologist and was assessed at early as possible.
CT Acquisition
Abdominal CT examinations were performed within 48 hours following sepsis diagnosis using the standardized parameters for all images, with two single-source 64-section CT units (Somatom Sensation 64, Siemens Healthineers and Brilliance 64, Phillips Healthcare). Portal venous phase images were obtained 70 to 90 seconds after intravenous administration of iodinated contrast material. No bolus tracking method was used for contrast agent administration to account for reduced cardiac output in the RA interpretation. Portal venous phase imaging features were as follows: nominal section thickness, 0.625 mm; beam pitch, 1.2; reconstruction interval, 1 mm; tube voltage, 120 kV; and tube current, 120–170 mA. Patients received 90 to 110 ml of contrast agent at a concentration of 350 mg/ml of iodine (iomeprol, Iomeron 350, Bracco Imaging) or iobitridol (Xenetix 350, Guerbet), which was administered intravenously with an automated power injector (OptiVantage, Mallinckrodt-Tyco/Healthcare) at an injection rate of 3.5 to 5 ml/sec.
Image Segmentation
RA was performed on abdominal CT images obtained during the portal venous phase. To ensure the reproducibility of the acquisition time, all patients for whom images did not meet the following quality criteria were excluded: (1) absence of hardening artifacts in the upper abdomen related to elbows, (2) enhancement of the portal venous system and veins, (3) no excretion of contrast in the urinary tract, and (4) uniform and homogeneous enhancement of splenic parenchyma.
Three CT images were selected for analysis for each patient. One slice was obtained through the pelvis of each kidney, and one slice showed the portal bifurcation at the porta hepatis. Quantitative radiomic features were extracted after semi-automatic segmentation of each kidney and of the whole liver using TexRAD software (Supplementary Figure 1). Manual adjustments of regions of interest were made by an abdominal radiologist (AD with 7 years of experience in RA) to confirm exact segmentation and blinded to clinical parameters. RA was performed following the Image Biomarker Standardization Initiative guidelines [15].
Image Analysis
RA was performed on features extracted from the distribution of pixel values in the region of interest. First order features included mean values, standard deviation, entropy, mean of positive pixels, skewness, and kurtosis. For each parameter, the segmented regions of interest were filtered using a Laplacian of the Gaussian transformation, and the features were measured at six different spatial scale filters (0, 2, 3, 4, 5, 6) [16].
All three-images were used in the model for mortality and AKI prediction. We hypothesized that using kidney and liver images would better reflect organ sepsis-associated damage and be representative of macro and microcirculation injury. Because the number of features “P” was much larger than the number of observations “N,” the risk of collinearity between variables and overfitting of models was high. To circumvent these caveats, we used and compared two different and robust models to select features before predicting in-hospital mortality or AKI. In the first model, we used elastic net regularized logistic regression. This method is a convex combination of ridge (L2 regularization) and least absolute shrinkage and selection operator, L1, regularization (LASSO) penalties. We hypothesized that variables are strongly correlated. The LASSO penalty is indifferent to the choice among a set of strong but correlated variables. The ridge penalty tends to shrink the coefficients of correlated variables toward each other. Elastic-net combines the advantages of the two regularization methods. The α-hyperparameter controls the balance between LASSO and ridge penalties, while λ controls the weight of the overall regularization. We used random forest for the second model. For the random forest method, the hyperparameter to tune is the optimal number of variables randomly sampled as candidates at each tree split (mtry).
Hyperparameter tuning was performed using five-fold cross-validation repeated 10 times: all datasets were divided into five groups, and four of them were used to train the models and were validated with the fifth group. This process was repeated 10 times with a different patient repartition in the same proportion. The final performances of the models were assessed on the folds that were not used for the construction. This avoided potential overfitting through the mean of all obtained areas under the curve (AUCs).
Statistical Analysis
Statistical analysis was conducted with R software (ver. 3.6.2, R Foundation for Statistical Computing). Qualitative variables were expressed as raw numbers, proportions, and percentages. Quantitative variables were expressed as means±standard deviations (SD) or medians and interquartile ranges (IQR; Q1–Q3) depending on the normality of the distribution [17]. Continuous variables were compared using a Mann-Whitney U-test. Categorical variables were compared using the chi-square or Fisher exact test as appropriate. The sensitivity, specificity, and the cross-validated area under the receiver operating curve with 95% confidence intervals (CIs) were computed using the Delong test and the bootstrap method [18]. The sensitivity, specificity, and accuracy of the models were calculated along with their 95% CI with the Clopper-Pearson method. The report of this study was performed in compliance with the Standards for Reporting of Diagnostic accuracy studies (STARD) statement. Performances of SAPS II, RA, or both were tested. Significance was set to P<0.05.
RESULTS
Study Population
Between January 2013 and December 2015, 126 patients (70 men, 56 women) were admitted for abdominal sepsis, and their records were screened. Ninety-one met the inclusion criteria, and 55 were included. Figure 1 shows the study flow chart. Table 1 summarized the characteristics of included patients. Four (7.3%) patients had chronic kidney disease and none had chronic liver disease.
The median age of the study population was 72 years (IQR, 57–82 years), median SOFA and median SAPS II (during sepsis diagnosis) were respectively 7 (IQR, 4.5–9.5) and 49 (IQR, 37–60). In-ICU mortality was 25.5%. Forty-nine patients (89.1%) were under mechanical ventilation for more than 24 hours, and 46 (83.6%) had surgical treatment. Forty-two patients (76.4%) developed AKI following a sepsis diagnosis, and nine (16.4%) needed renal replacement therapy. The median lactate during sepsis diagnosis value was 2.7 µmol/L (IQR, 1.9–4.3 µmol/L). The median duration of hospitalization was 9 days (IQR, 5–21 days). Abdominal sepsis origin was peritonitis for 35 patients (63.6%). Nine patients (16.4%) were diagnosed with ischemic colitis, and eight (14.5%) were diagnosed with cholangitis (Table 1). There was no missing data concerning the RA parameters or the primary and secondary endpoints.
Factors Associated with In-ICU Mortality
Except for SOFA, SAPS II, and lactate dosage, no significant differences in other variables were found between survivors and non-survivors (P=0.03). Table 2 details characteristics of in-ICU survivors and non-survivors.
Factors Associated with AKI
Patients who experienced AKI (AKI vs. no AKI) had more chronic heart failure (30.9% vs. 0%, P=0.01), a higher SOFA score (7.0 [IQR, 6–10.8] vs. 5 [IQR, 2–6.0], P=0.02), and a higher SAPS II score (54 [IQR, 43.5–61.25] vs. 40 [IQR, 24–49], P=0.01). Table 2 details the patients that developed AKI or not.
Radiomic Analyses
Supplementary Table 1 reports RA values.
Prediction of In-hospital Mortality
Associations of RA values and in-ICU mortality are reported in Supplementary Table 2. As a result of the elastic net and random forest analyses, mortality was associated with RA, and the importance of each parameter for predicting different models is presented in Supplementary Figure 2. Using elastic net, the cross-validated AUC for in-ICU mortality was 0.48 (95% CI, 0.43–0.54), optimal threshold yielded 22% sensitivity (95% CI, 16%–30%), 67% specificity (95% CI, 62%–71%) and 55% accuracy (95% CI, 51%–60%). Using the random forest method, the cross-validated AUC for in-ICU mortality was 0.51 (95% CI, 0.45–0.57), optimal threshold yielded 14% sensitivity (95% CI, 8.8%–20%), 90% specificity (95% CI, 87%–93%) and 71% accuracy (95% CI, 67%–74%) (Table 3).
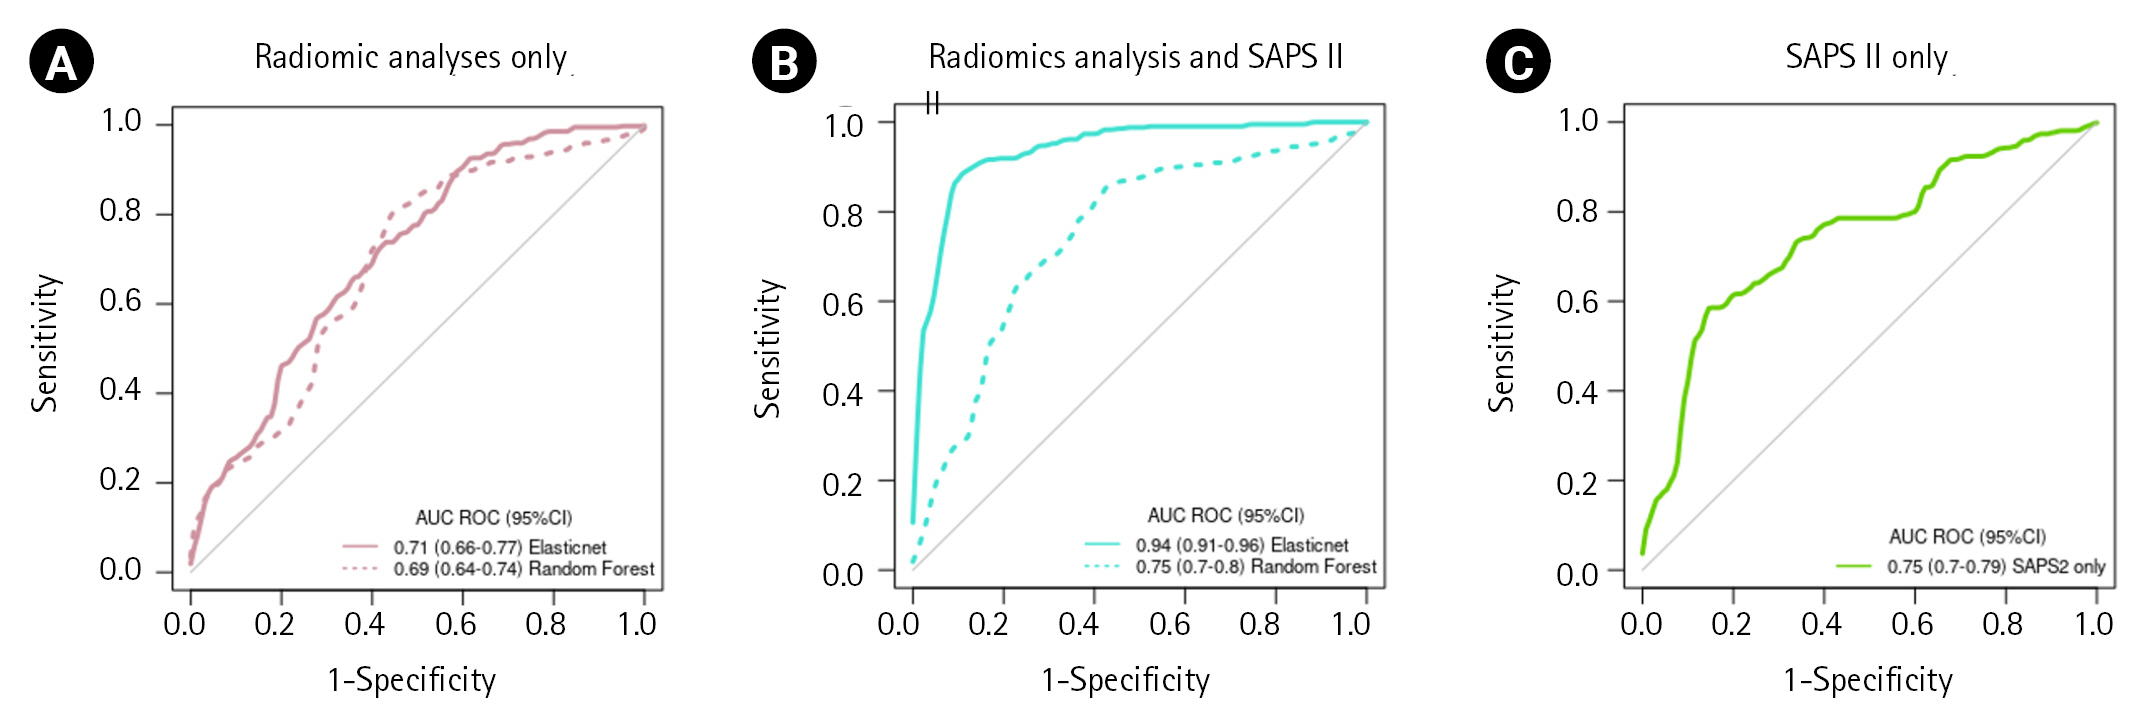
The association of RA with SAPS II for in-ICU mortality prediction was assessed, and variable importance is presented in Supplementary Figure 3. For the combination of RA and SAPS II, the elastic net cross-validated AUC was 0.57 (95% CI, 0.52–0.62), optimal threshold yielded 25% sensitivity (95% CI, 19%–33%), 76% specificity (95% CI, 71%–80%) and 63% accuracy (95% CI, 59%–67%). The random forest cross-validated AUC was 0.51 (95% CI, 0.45–0.56), optimal threshold yielded 6.4% sensitivity (95% CI, 3.4%–12%), 90% specificity (95% CI, 87%–92%) and 69% accuracy (95% CI, 65%–73%). SAPS II alone had a cross-validated AUC of 0.68 (95% CI, 0.63–0.73), optimal threshold yielded 10% sensitivity (95% CI, 6.1%–16%), 94% specificity (95% CI, 92%–96%) and 73% accuracy (95% CI, 69%–77%) (Table 3). Figure 2 shows ROC curves for mortality.
Prediction of AKI
Supplementary Table 3 reports RA values and AKI associations. The elastic net and the random forest analyses identified RA associated with AKI, the variable importance of each parameter for prediction of different models are presented in Supplementary Figure 4. Using elastic net, the cross-validated AUC for AKI was 0.71 (95% CI, 0.66–0.77), optimal thresholds yielded 99% sensitivity (95% CI, 98.8%–99.9%), 0.7% specificity (95% CI, 0.1%–4.7%) and 76% accuracy (95% CI, 73%–80%). Using the random forest method, the cross-validated AUC for AKI was 0.69 (95% CI, 0.64–0.74), optimal threshold yielded 97% sensitivity (95% CI, 95%–98%), 6.1% specificity (95% CI, 3.1%–12%) and 75% accuracy (95% CI, 72%–79%) (Table 3).
The association of RA with SAPS II for AKI prediction was assessed, and variable importance is presented in Supplementary Figure 5. For the combination of RA and SAPS II, the elastic net cross-validated AUC was 0.94 (95% CI, 0.91–0.96), optimal threshold yielded 95% sensitivity (95% CI, 93%–97%), 69% specificity (95% CI, 61%–77%) and 89% accuracy (95% CI, 86%–92%), and the random forest cross-validated AUC was 0.75 (95% CI, 0.7–0.8), optimal threshold yielded 94% sensitivity (95% CI, 92%–96%), 17% specificity (95% CI, 11%–24%) and 76% accuracy (95% CI, 72%–80%). SAPS II alone had a cross-validated AUC of 0.75 (95% CI, 0.70–0.79), optimal threshold yielded 91% sensitivity (95% CI, 88%–94%), 32% specificity (95% CI, 25%–41%) and 77% accuracy (95% CI, 74%–81%) (Table 3). ROC curves for mortality prediction are shown in Figure 3.
DISCUSSION
In this study, we found that RA had poor predictive performance for in-ICU mortality and good predictive performance for AKI in patients with sepsis from abdominal origin. Association of RA with SAPS II appeared to show the best AKI prediction performances. These results suggest that the use of RA from data extracted from CT may help ICU physicians to stratify patients with sepsis. In this study, a statistical model for RA was evaluated, but further validation is required.
Clinical utility of RA was investigated in the cancer field and predicted relevant outcomes [8-10]. RA was recently used to evaluate tissue composition and perfusion. Murgia et al. [19] investigated the clinical utility of RA to characterize and diagnose coronary plaques. The authors demonstrated that RA and machine learning models can identify and categorize coronary atherosclerotic plaques with a high accuracy. Liu et al. investigated the performance of RA to identify portal hypertension in cirrhosis. They found that RA could accurately diagnose portal hypertension without invasive procedure [20]. Those examples illustrate the potential of RA to study organ alterations during sepsis.
The pathophysiology of organ failure during sepsis is complex and requires both inflammatory and perfusion involvement. Indeed, tissues undergo perfusion alteration due to microvascular obstructions and are affected by immune activation and inflammation [5,21,22]. Based on these observations, we hypothesized that RA could be impacted by sepsis and give ICU physicians additional data regarding the outcome or organ failure.
In the current study, poor associations were found between RA and in-ICU mortality, but several RA features were identified as predictors of AKI and even more when associated with severity scores. We speculated that the changes in organ congestion and perfusion are reflected in the RA features. Considering that liver failure is known to contribute to AKI [23], perfusional change in the liver reflected in the RA features may partly explain the model's prediction of AKI. In addition, RA features of all images (including liver and kidney) may represent global or organ specific microcirculation and be related to mortality or AKI, as it remains a frequent complication in severely ill patients. This is because RA features do not necessarily reflect perfusional change considering they can also reflect parenchymal texture heterogeneity. Moreover, SAPSII is not intended to predict AKI. However, the combination of SAPS II with predictive models improved the evaluation of the severity of the patients as it is associated with high mortality rates.
In this study, a robust analytical method was used to elucidate the relationship between RA and outcomes. First, imaging and analysis was performed with the same technique for all the population to limit internal bias. This was inspired by a previously published protocol from Image Biomarker Standardization Initiative [15]. We aimed at avoiding misinterpretations due to the large number of covariates and their potential collinearity [24] by comparing two analytical strategies. First, we used elastic net penalized logistic regression that takes advantage of two types of regularization with different objectives. The Ridge penalization solves the problem of highly correlated variables, while LASSO allows the selection of relevant variables. Cross-validation was used both to select the tuning hyperparameters and to assess the performances of the model. Then, we compared this strategy to a machine-learning algorithm well known for its performance, the random forest algorithm [25,26]. Parmar et al. [27] evaluated the use of machine learning algorithms for radiomic prediction and found that the random forest (rather than the Wilcoxon) method for parameter selection showed the best performance. In contrast, penalized logistic regression has been poorly evaluated in this setting [28]. Both algorithms showed consistent results regarding prediction of in-ICU AKI but needed more optimization for prediction of in-ICU mortality. As a pilot study, the use of two predictive models improved predictive performance assessed for in-ICU mortality or AKI. Despite cross-validation, the model's internal validation would need to be strengthened using a validation cohort.
According to the present study, the in-ICU mortality of sepsis was 25%, and SOFA score and SAPS II calculated during the first 24 hours of sepsis were similar to those found in recent literature [21]. AKI had a prevalence close to 70% in this cohort, with a median KDIGO grade of 3. Epidemiologic studies reported a lower prevalence ranging between 40 and 50% for AKI in ICU for septic patients [29,30]. This emphasizes the importance of risk assessment in this population. For instance, the algorithm will easily predict AKI because it is a very frequent condition in our population. To limit this proportion bias, performance prediction was estimated using AUC to assess the same importance for AKI and non-AKI. In this regard, RA could represent a valuable tool based on existing CT data.
This study has several limitations. Some limits are due to the retrospective nature of the study, the limited number of selected patients, and the lack of information regarding preexisting cardiovascular, respiratory, or hemodynamic status before sepsis. Moreover, although CT data used for RA were obtained with the same equipment, CT imaging parameters were protocolized. Image segmentation was assessed by manual correction, and this might have induced intra-observer bias. However, segmentation was made on a single slice of liver and kidneys with a vascular landmark, which is reproducible and representative of the whole tumor analysis [31]. In addition, Ng et al. [31] have shown that single slice analysis can be used as a surrogate of whole organ segmentation for RA for tumor analysis. However, extrapolation to sepsis has not been validated to date, and this method could remain a limitation of our study. Imaging was assessed during the 48 hours before or after sepsis diagnosis and patient selection depended on imaging, thus limiting the generalization of results. The diagnosis of AKI was assessed within seven days after sepsis in our study, and AKI might have occurred before or after CT examination. Consequently, the role of contrast material in the development of worsening of AKI cannot be excluded. However, the real rate and existence of AKI due to iodinated contrast material is debated and is undoubtedly less frequent than AKI due to sepsis. However, this study did not allow calculation of the exact number of patients with contrast induced AKI, and it may have been miscategorized as sepsis induced AKI due to the time overlap [32].
Finally, severe sepsis causes multiple organ failures leading to death. AKI is associated with mortality in studies [29,30]. In this study, we focused RA analysis on liver and kidney imaging. Thus, mortality during sepsis could be associated with other organ failures such as the heart, or the brain that were not considered in this study. This might explain RA’s poor performance for our primary endpoint.
Moreover, several technical aspects need to be further investigated to ensure the reliability and generalizability of the radiomic features of a given lesion. This is because this preliminary study lacks internal validation as it is a single-center study with a small sample size. To make radiomics a reality in the clinical daily routine, further advances are needed to render such technology sufficiently user-friendly and time effective.
In conclusion, we found that RA has poor predictive performance for in-ICU mortality but good predictive performance for AKI in patients with sepsis from abdominal origin. Association of RA with SAPS II appears to show the best AKI prediction performances. These results suggest that RA from CT data may help stratify sepsis patients. However, validation with a larger prospective cohort is needed to confirm our model.
HIGHLIGHTS
▪ This study assessed a model that showed that radiomic analysis (RA) had poor predictive performance for in-intensive care unit (ICU) mortality but good predictive performance for acute kidney injury in patients with abdominal sepsis.
▪ These results suggest that the use of RA from computed tomography may help ICU physicians to stratify patients with sepsis..
NOTES
-
CONFLICT OF INTEREST
No potential conflict of interest relevant to this article was reported.
-
FUNDING
None.
-
ACKNOWLEDGMENTS
None.
-
AUTHOR CONTRIBUTIONS
Conceptualization: AD, BGC, LB. Methodology: LB, LM, AM, BGC. Formal analysis: LB, LM, AD, BGC. Data curation: LB, LM, BGC, FR, RB, AD. Visualization: LB, BGC. Project administration: LB, AM, BGC. Writing–original draft: all authors. Writing–review & editing: all authors.
SUPPLEMENTARY MATERIALS
Supplementary materials can be found via https://doi.org/10.4266/acc.2023.00136.
Supplementary Figure 2.
Selected texture feature and importance representation using elastic net (A) and random forest method (B) for prediction of mortality.
acc-2023-00136-Supplementary-Fig-2.pdf
Supplementary Figure 3.
Selected texture feature + Simplified Acute Physiology Score (SAPS) II and importance representation using elastic net and random forest method for predicting mortality.
acc-2023-00136-Supplementary-Fig-3.pdf
Supplementary Figure 4.
Selected texture feature and importance representation using elastic net and random forest method for prediction of acute kidney injury.
acc-2023-00136-Supplementary-Fig-4.pdf
Supplementary Figure 5.
Selected texture feature + Simplified Acute Physiology Score (SAPS) II and importance representation using elastic net and random forest method for prediction of acute kidney injury.
acc-2023-00136-Supplementary-Fig-5.pdf
Figure 1.Study flow chart. CT: computed tomography.
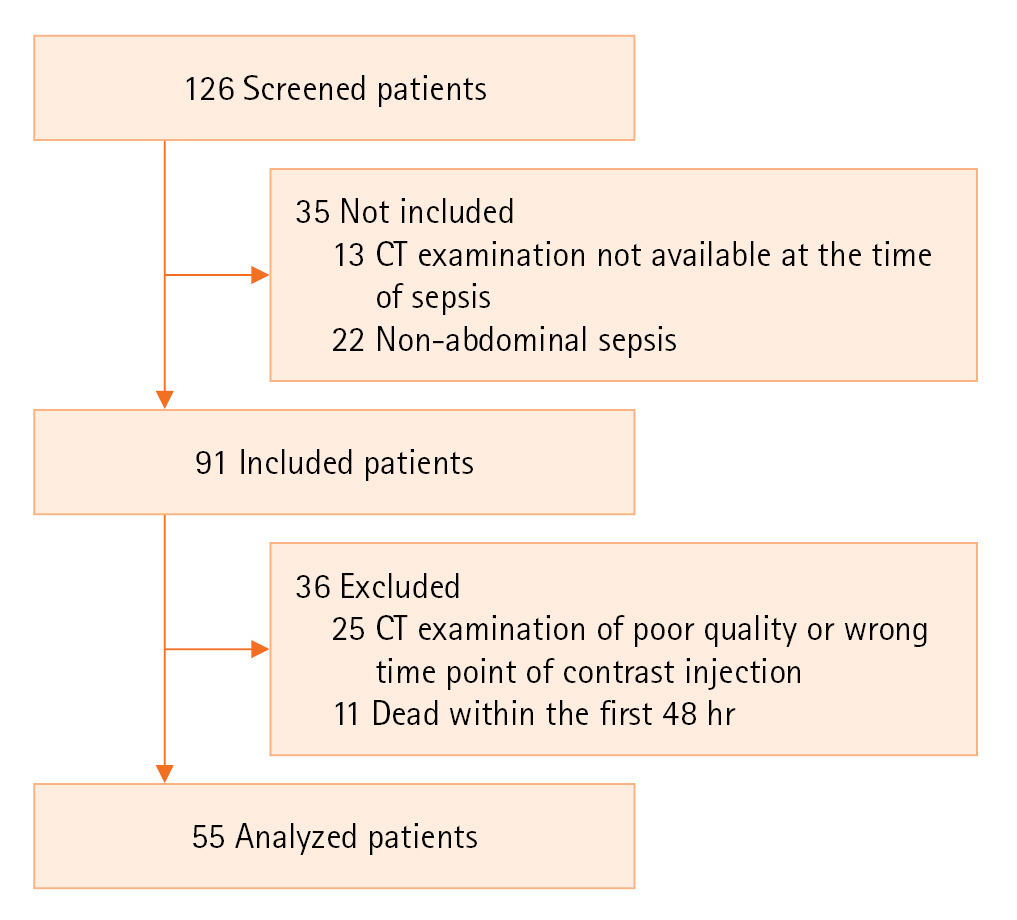
Figure 2.Receiver operating characteristic (ROC) curve for in-intensive care unit mortality prediction using radiomic analysis alone (A), using radiomic analysis and Simplified Acute Physiology Score (SAPS) II (B), using SAPS II alone (C). AUC: area under the curve; CI: confidence interval.
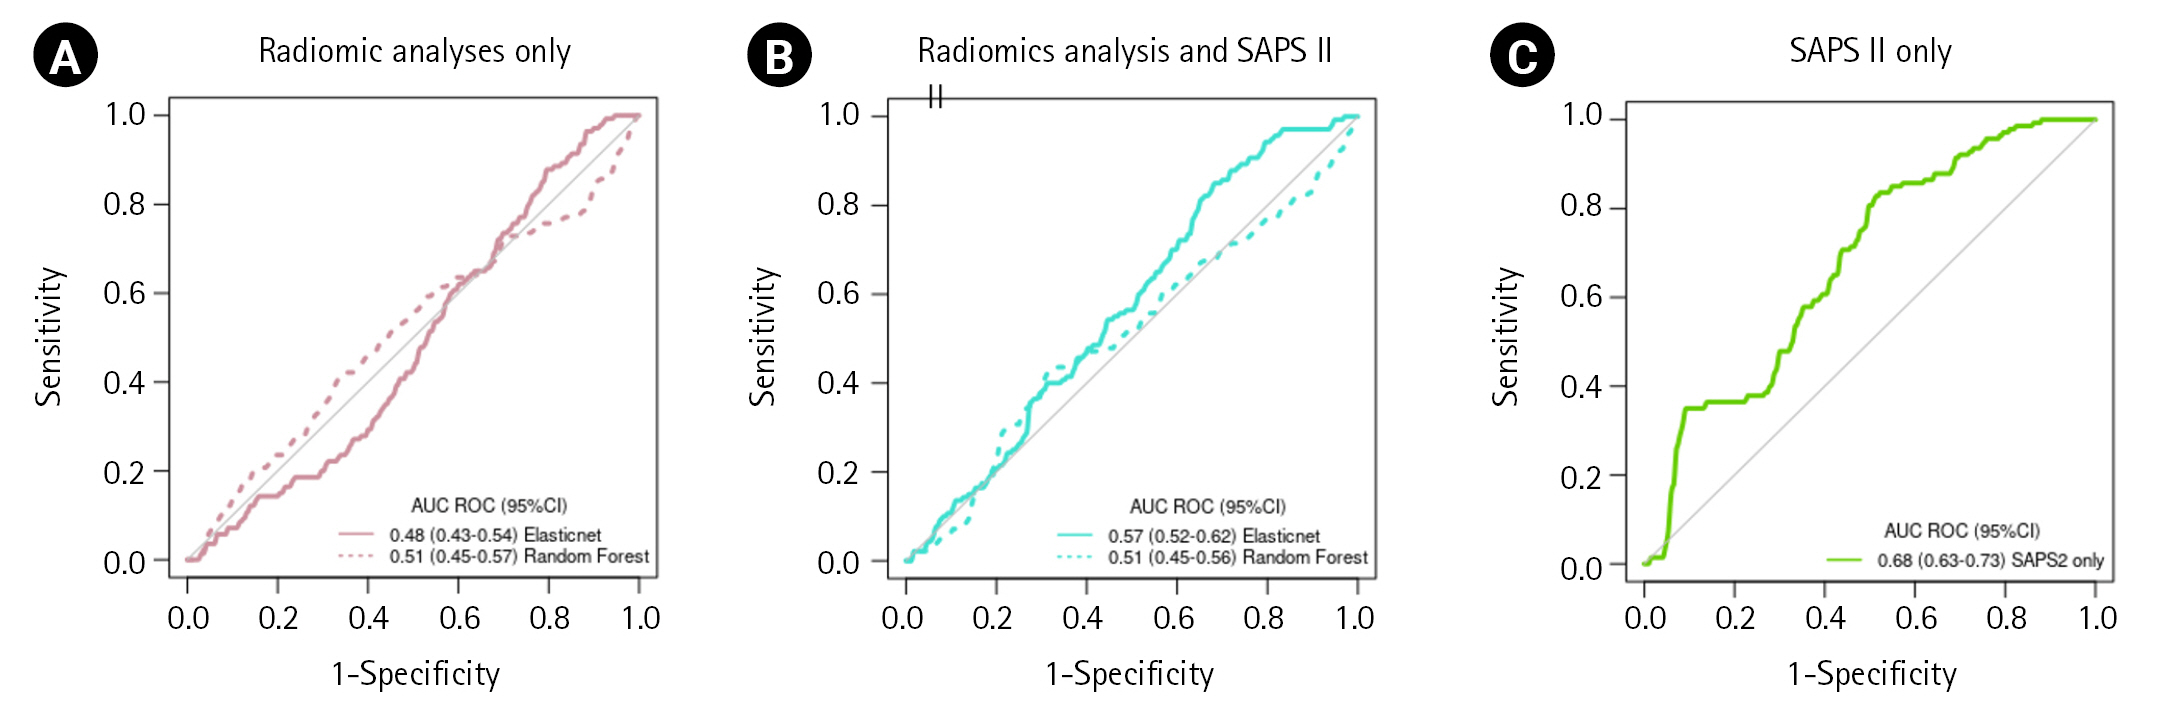
Figure 3.Receiver operating characteristic (ROC) curve for acute kidney injury prediction using radiomic analysis alone (A), using radiomic analysis and Simplified Acute Physiology Score (SAPS) II (B), using SAPS II alone (C). AUC: area under the curve; CI: confidence interval.

Table 1.Characteristics of included patients
|
Characteristic |
Value |
|
Male |
33 (60) |
|
Age (yr) |
72 (57–82) |
|
Medical history |
|
|
Cardiovascular risk factorsa)
|
38 (69.1) |
|
Chronic heart failure |
17 (30.9) |
|
COPD |
8 (14.5) |
|
CKD |
4 (7.3) |
|
Reason for admission |
|
|
Peritonitis |
35 (63.6) |
|
Ischemic colitis |
9 (16.4) |
|
Cholangitis |
8 (14.5) |
|
Othersb)
|
3 (5.4) |
|
Mechanical ventilation |
49 (89.1) |
|
Duration of ventilation (day) |
5 (2–14) |
|
Length of hospitalization (day) |
9 (5–21) |
|
Surgical treatment |
46 (83.6) |
|
Vasopressor treatment |
52 (94.5) |
|
AKI |
42 (76.4) |
|
KDIGO score |
1 (1–2) |
|
RRT |
9 (16.4) |
|
Lactate (mmol/L) |
2.7 (1.9–4.3) |
|
In-ICU mortality |
14 (25.5) |
|
Serum creatinine during sepsis (mg/dl) |
1.1 (0.74–1.63) |
|
Severity scores at the day of sepsis |
|
|
SOFA score 24 hr |
7 (4.50–9.50) |
|
SAPS II |
49 (37–60) |
|
Sepsis |
3 (5.50) |
|
Septic shock |
52 (94.5) |
Table 2.Characteristics of in-ICU survivors vs. non-survivors and characteristics of patients with acute kidney injury or no acute kidney injury
|
Variable |
Dead (n=14) |
Survivor (n=41) |
P-value |
AKI (n=42) |
No AKI (n=13) |
P-value |
|
Male |
8 (14.5) |
25 (45.5) |
0.51 |
27 (49.1) |
6 (10.9) |
0.20 |
|
Age (yr) |
77.9 (59.1–84) |
70.1 (52.9–81.1) |
0.21 |
73.3 (60.47–83.3) |
57.15 (46.15–73.22) |
0.08 |
|
Medical history |
|
|
|
|
|
|
|
Cardiovascular risk factor |
10 (18.2) |
28 (50.9) |
0.55 |
31 (56.4) |
7 (12.7) |
0.15 |
|
Chronic heart failure |
4 (7.3) |
13 (23.6) |
0.55 |
17 (30.9) |
0 |
0.01 |
|
COPD |
4 (7.3) |
4 (7.3) |
0.10 |
8 (14.5) |
0 |
0.10 |
|
CKD |
1 (1.8) |
3 (5.5) |
0.73 |
4 (7.3) |
0 |
0.33 |
|
Reason for admission |
|
|
0.80 |
|
|
0.11 |
|
Peritonitis |
8 (14.5) |
27 (49.1) |
|
26 (47.3) |
9 (16.4) |
|
|
Ischemic colitis |
3 (5.5) |
6 (10.9) |
|
9 (16.4) |
0 |
|
|
Cholangitis |
1 (1.8) |
7 (12.7) |
|
6 (10.9) |
2 (3.6) |
|
|
Others |
2 (3.6) |
1 (1.8) |
|
1 (1.8) |
2 (3.6) |
|
|
Mechanical ventilation |
14 (25.5) |
35 (63.6) |
0.16 |
39 (70.9) |
10 (18.2) |
0.13 |
|
Duration of ventilation (day) |
9 (2.75–20.75) |
4 (2–12) |
0.17 |
5 (2–14) |
4 (1–16.5) |
0.62 |
|
Length of hospitalization (day) |
9 (6–19.8) |
9 (4.5–22.5) |
0.9 |
9 (5.75–19.25) |
9 (4.0–59) |
0.90 |
|
Surgical treatment |
12 (21.8) |
34 (61.8) |
0.59 |
36 (65.5) |
10 (18.2) |
0.36 |
|
Vasopressor therapy |
14 (25.5) |
37 (67.3) |
0.30 |
40 (72.7) |
11 (20) |
0.23 |
|
Lactate (µmol/L) |
3.8 (2.8–7.5) |
2.3 (1.5–3.5) |
0.02 |
3.1 (2.4–4.4) |
2.0 (1.3–2.2) |
0.01 |
|
In-ICU mortality |
- |
- |
- |
12 (21.8) |
2 (3.6) |
0.30 |
|
AKI |
12 (21.8) |
30 (54.5) |
0.20 |
- |
- |
- |
|
KDIGO score |
2 (1–3) (n=12) |
1 (1–2) (n=30) |
0.10 |
- |
- |
- |
|
RRT |
6 (10.9) |
3 (5.5) |
0.01 |
9 (16.4) |
0 |
0.07 |
|
SOFA score |
7.5 (7.0–11) |
6 (4.0–9.0) |
0.05 |
7.0 (6.0–10.8) |
5 (2.0–6.0) |
0.02 |
|
SAPS II |
56.0 (49–70.8) |
48 (31.5–58.5) |
0.03 |
54.0 (43.5–61.25) |
40 (24–49) |
0.01 |
|
Sepsis |
0 |
3 (5.5) |
0.72 |
1 (1.8) |
2 (3.6) |
0.27 |
|
Septic shock |
14 (25.5) |
38 (69) |
- |
41 (74.5) |
11 (20) |
- |
Table 3.Cross-validated AUC of models for prediction of mortality and AKI
|
Variable |
Prediction parameter |
AUC (95% CI) |
Sensitivity, % (95% CI) |
Specificity, % (95% CI) |
Accuracy, % (95% CI) |
|
Prediction of mortality |
|
|
|
|
|
|
Radiomic analysis |
|
|
|
|
|
|
Elastic net |
Alpha=0.6 |
0.48 (0.43–0.54) |
22 (16–30) |
67 (62–71) |
55 (51–60) |
|
|
Lambda=0.003 |
|
|
|
|
|
Random forest |
mtry=49 |
0.51 (0.45–0.57) |
14 (8.8–20) |
90 (87–93) |
71 (67–74) |
|
Radiomic analysis+SAPS II |
|
|
|
|
|
|
Elastic net |
Alpha=0.6 |
0.57 (0.52–0.62) |
25 (19–33) |
76 (71–80) |
63 (59–67) |
|
|
Lambda=0.006 |
|
|
|
|
|
Random forest |
mtry=73 |
0.51 (0.45–0.56) |
6.4 (3.4–12) |
90 (87–92) |
69 (65–73) |
|
SAPS II |
|
0.68 (0.63–0.73) |
10 (6.1–16) |
94 (92–96) |
73 (69–77) |
|
Prediction of AKI |
|
|
|
|
|
|
Radiomic analysis |
|
|
|
|
|
|
Elastic net |
Alpha=0.9 |
0.71 (0.66–0.77) |
99 (98.8–99.9) |
0.7 (0.1–4.2) |
76 (73–80) |
|
Lambda=0.20 |
|
|
|
|
|
Random forest |
mtry=2 |
0.69 (0.64–0.74) |
97 (95–98) |
6.1 (3.1–12) |
75 (72–79) |
|
Radiomic analysis+SAPS II |
|
|
|
|
|
|
Elastic net |
Alpha=0.9 |
0.94 (0.91–0.96) |
95 (93–97) |
69 (61–77) |
89 (86–92) |
|
|
Lambda=0.006 |
|
|
|
|
|
Random forest |
mtry=109 |
0.75 (0.70–0.80) |
94 (92–96) |
17 (11–24) |
76 (72–80) |
|
SAPS II |
|
0.75 (0.70–0.79) |
91 (88–94) |
32 (25–41) |
77 (74–81) |
References
- 1. Sakr Y, Jaschinski U, Wittebole X, Szakmany T, Lipman J, Ñamendys-Silva SA, et al. Sepsis in intensive care unit patients: worldwide data from the intensive care over nations audit. Open Forum Infect Dis 2018;5:ofy313. ArticlePubMedPMCPDF
- 2. Lewis JM, Abouyannis M, Katha G, Nyirenda M, Chatsika G, Feasey NA, et al. Population incidence and mortality of sepsis in an urban African setting, 2013-2016. Clin Infect Dis 2020;71:2547-52.ArticlePubMedPDF
- 3. Heldens M, Schout M, Hammond NE, Bass F, Delaney A, Finfer SR. Sepsis incidence and mortality are underestimated in Australian intensive care unit administrative data. Med J Aust 2018;209:255-60.ArticlePubMedPDF
- 4. Bouglé A, Duranteau J. Pathophysiology of sepsis-induced acute kidney injury: the role of global renal blood flow and renal vascular resistance. Contrib Nephrol 2011;174:89-97.PubMed
- 5. Bateman RM, Sharpe MD, Jagger JE, Ellis CG. Sepsis impairs microvascular autoregulation and delays capillary response within hypoxic capillaries. Crit Care 2015;19:389. ArticlePubMedPMCPDF
- 6. Ahmed W, Memon JI, Rehmani R, Al Juhaiman A. Outcome of patients with acute kidney injury in severe sepsis and septic shock treated with early goal-directed therapy in an intensive care unit. Saudi J Kidney Dis Transpl 2014;25:544-51.ArticlePubMed
- 7. Lopes JA, Jorge S, Resina C, Santos C, Pereira A, Neves J, et al. Acute kidney injury in patients with sepsis: a contemporary analysis. Int J Infect Dis 2009;13:176-81.ArticlePubMed
- 8. Long L, Sun J, Jiang L, Hu Y, Li L, Tan Y, et al. MRI-based traditional radiomics and computer-vision nomogram for predicting lymphovascular space invasion in endometrial carcinoma. Diagn Interv Imaging 2021;102:455-62.ArticlePubMed
- 9. Xue C, Zhou Q, Xi H, Zhou J. Radiomics: a review of current applications and possibilities in the assessment of tumor microenvironment. Diagn Interv Imaging 2023;104:113-22.ArticlePubMed
- 10. Aujay G, Etchegaray C, Blanc JF, Lapuyade B, Papadopoulos P, Pey MA, et al. Comparison of MRI-based response criteria and radiomics for the prediction of early response to transarterial radioembolization in patients with hepatocellular carcinoma. Diagn Interv Imaging 2022;103:360-6.ArticlePubMed
- 11. Lubner MG, Stabo N, Lubner SJ, del Rio AM, Song C, Halberg RB, et al. CT textural analysis of hepatic metastatic colorectal cancer: pre-treatment tumor heterogeneity correlates with pathology and clinical outcomes. Abdom Imaging 2015;40:2331-7.ArticlePubMedPDF
- 12. Miles KA, Ganeshan B, Hayball MP. CT texture analysis using the filtration-histogram method: what do the measurements mean? Cancer Imaging 2013;13:400-6.ArticlePubMedPMC
- 13. Singer M, Deutschman CS, Seymour CW, Shankar-Hari M, Annane D, Bauer M, et al. The third international consensus definitions for sepsis and septic shock (Sepsis-3). JAMA 2016;315:801-10.ArticlePubMedPMC
- 14. Kidney Disease: Improving Global Outcomes (KDIGO) CKD-MBD Work Group. KDIGO clinical practice guideline for the diagnosis, evaluation, prevention, and treatment of chronic kidney disease-mineral and bone disorder (CKD-MBD). Kidney Int Suppl 2009;(113):S1-130. PubMed
- 15. Zwanenburg A, Vallières M, Abdalah MA, Aerts H, Andrearczyk V, Apte A, et al. The image biomarker standardization initiative: standardized quantitative radiomics for high-throughput image-based phenotyping. Radiology 2020;295:328-38.ArticlePubMedPMC
- 16. Bonnin A, Durot C, Barat M, Djelouah M, Grange F, Mulé S, et al. CT texture analysis as a predictor of favorable response to anti-PD1 monoclonal antibodies in metastatic skin melanoma. Diagn Interv Imaging 2022;103:97-102.ArticlePubMed
- 17. Barat M, Jannot AS, Dohan A, Soyer P. How to report and compare quantitative variables in a radiology article. Diagn Interv Imaging 2022;103:571-3.ArticlePubMed
- 18. Tsamardinos I, Greasidou E, Borboudakis G. Bootstrapping the out-of-sample predictions for efficient and accurate cross-validation. Mach Learn 2018;107:1895-922.ArticlePubMedPMCPDF
- 19. Murgia A, Balestrieri A, Crivelli P, Suri JS, Conti M, Cademartiri F, et al. Cardiac computed tomography radiomics: an emerging tool for the non-invasive assessment of coronary atherosclerosis. Cardiovasc Diagn Ther 2020;10:2005-17.ArticlePubMedPMC
- 20. Liu F, Ning Z, Liu Y, Liu D, Tian J, Luo H, et al. Development and validation of a radiomics signature for clinically significant portal hypertension in cirrhosis (CHESS1701): a prospective multicenter study. EBioMedicine 2018;36:151-8.ArticlePubMedPMC
- 21. Stevenson EK, Rubenstein AR, Radin GT, Wiener RS, Walkey AJ. Two decades of mortality trends among patients with severe sepsis: a comparative meta-analysis. Crit Care Med 2014;42:625-31.PubMedPMC
- 22. Lush CW, Kvietys PR. Microvascular dysfunction in sepsis. Microcirculation 2000;7:83-101.ArticlePubMed
- 23. Chancharoenthana W, Leelahavanichkul A. Acute kidney injury spectrum in patients with chronic liver disease: where do we stand? World J Gastroenterol 2019;25:3684-703.ArticlePubMedPMC
- 24. Matzner-Lober E, Suehs CM, Dohan A, Molinari N. Thoughts on entering correlated imaging variables into a multivariable model: application to radiomics and texture analysis. Diagn Interv Imaging 2018;99:269-70.ArticlePubMed
- 25. Zhang Z, Lai Z, Xu Y, Shao L, Wu J, Xie GS. Discriminative elastic-net regularized linear regression. IEEE Trans Image Process 2017;26:1466-81.ArticlePubMed
- 26. Rigatti SJ. Random Forest. J Insur Med 2017;47:31-9.ArticlePubMedPDF
- 27. Parmar C, Grossmann P, Bussink J, Lambin P, Aerts HJ. Machine learning methods for quantitative radiomic biomarkers. Sci Rep 2015;5:13087. ArticlePubMedPMCPDF
- 28. Shi T, Horvath S. Unsupervised learning with random forest predictors. J Comput Graph Stat 2006;15:118-38.Article
- 29. Hoste EA, Bagshaw SM, Bellomo R, Cely CM, Colman R, Cruz DN, et al. Epidemiology of acute kidney injury in critically ill patients: the multinational AKI-EPI study. Intensive Care Med 2015;41:1411-23.ArticlePubMedPDF
- 30. Peerapornratana S, Manrique-Caballero CL, Gómez H, Kellum JA. Acute kidney injury from sepsis: current concepts, epidemiology, pathophysiology, prevention and treatment. Kidney Int 2019;96:1083-99.ArticlePubMedPMC
- 31. Ng F, Kozarski R, Ganeshan B, Goh V. Assessment of tumor heterogeneity by CT texture analysis: can the largest cross-sectional area be used as an alternative to whole tumor analysis? Eur J Radiol 2013;82:342-8.ArticlePubMed
- 32. Ehmann MR, Mitchell J, Levin S, Smith A, Menez S, Hinson JS, et al. Renal outcomes following intravenous contrast administration in patients with acute kidney injury: a multi-site retrospective propensity-adjusted analysis. Intensive Care Med 2023;49:205-15.ArticlePubMedPDF
Citations
Citations to this article as recorded by


 , Louis Morisson1


 PubReader
 ePub Link
 Cite
Cite