Articles
- Page Path
- HOME > Acute Crit Care > Volume 37(3); 2022 > Article
-
Original Article
Pediatrics Clinical implications of discrepancies in predicting pediatric mortality between Pediatric Index of Mortality 3 and Pediatric Logistic Organ Dysfunction-2 -
Eui Jun Lee1
 , Bongjin Lee2, You Sun Kim3, Yu Hyeon Choi4, Young Ho Kwak1, June Dong Park2,5
 -
Acute and Critical Care 2022;37(3):454-461.
DOI: https://doi.org/10.4266/acc.2021.01480
Published online: July 29, 2022
1Department of Emergency Medicine, Seoul National University College of Medicine, Seoul, Korea
2Department of Pediatrics, Seoul National University College of Medicine, Seoul, Korea
3Department of Department of Pediatrics, National Medical Center, Seoul, Korea
4Department of Pediatrics, Hanyang University Medical Center, Seoul, Korea
5Wide River Institute of Immunology, Seoul National University, Hongcheon, Korea
- Corresponding author: Bongjin Lee Department of Pediatrics, Seoul National University Hospital, 101 Daehak-ro, Jongno-gu, Seoul 03080, Korea Tel: +82-2-2072-3568 Fax: +82-2-2072-0274 E-mail: pedbjl@snu.ac.kr
Copyright © 2022 The Korean Society of Critical Care Medicine
This is an Open Access article distributed under the terms of the Creative Commons Attribution Non-Commercial License (http://creativecommons.org/licenses/by-nc/4.0/) which permits unrestricted non-commercial use, distribution, and reproduction in any medium, provided the original work is properly cited.
- 2,223 Views
- 159 Download
Abstract
-
Background
- Pediatric Index of Mortality 3 (PIM 3) and Pediatric Logistic Organ Dysfunction-2 (PELOD-2) are validated tools for predicting mortality in children. Research suggests that these tools may have different predictive performance depending on patient group characteristics. Therefore, we designed this study to identify the factors that make the mortality rates predicted by the tools different.
-
Methods
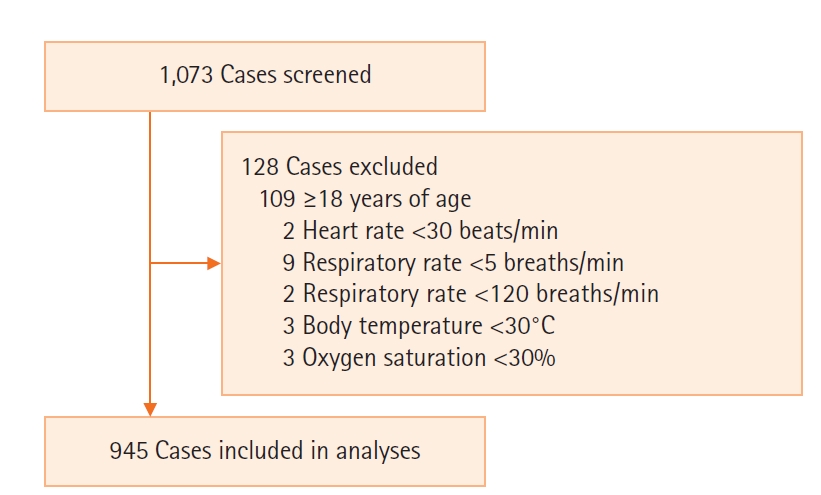
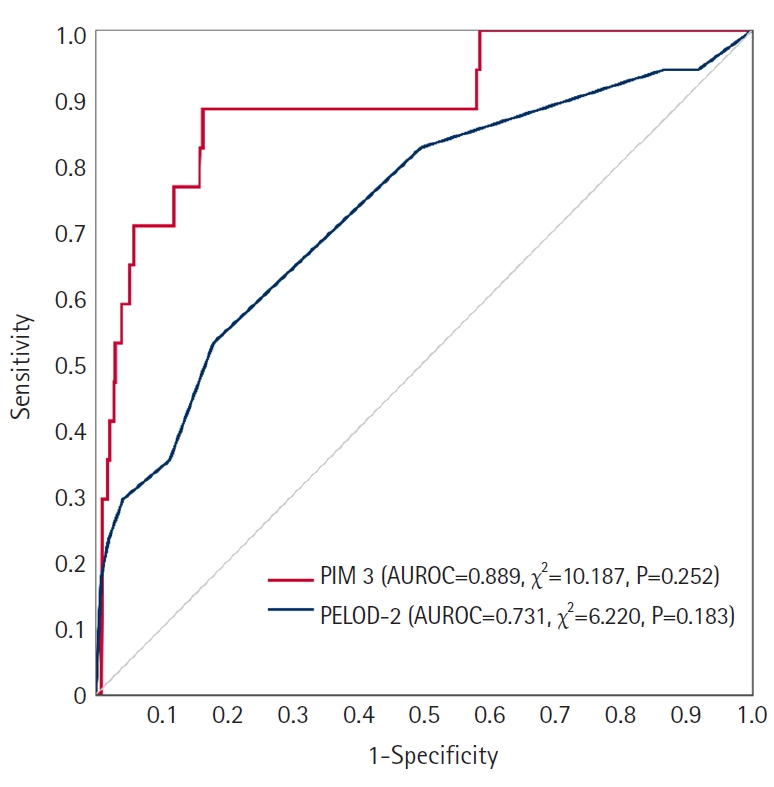
- This retrospective study included patients (<18 years) who were admitted to a pediatric intensive care unit from July 2017 to May 2019. After defining the predicted mortality of PIM 3 minus the predicted mortality rate of PELOD-2 as “difference in mortality prediction,” the clinical characteristics significantly related to this were analyzed using multivariable regression analysis. Predictive performance was analyzed through the Hosmer-Lemeshow test and area under the receiver operating characteristic curve (AUROC).
-
Results
- In total, 945 patients (median [interquartile range] age, 3.0 [0.0–8.0] years; girls, 44.7%) were analyzed. The Hosmer-Lemeshow test revealed AUROCs of 0.889 (χ2=10.187, P=0.313) and 0.731 (χ2=6.220, P=0.183) of PIM 3 and PELOD-2, respectively. Multivariable linear regression analysis revealed that oxygen saturation, partial pressure of CO2, base excess, platelet counts, and blood urea nitrogen levels were significant factors. Patient condition-related factors such as cardiac bypass surgery, seizures, cardiomyopathy or myocarditis, necrotizing enterocolitis, cardiac arrest, leukemia or lymphoma after the first induction, bone marrow transplantation, and liver failure were significantly related (P<0.001).
-
Conclusions
- Both tools predicted observed mortality well; however, caution is needed in interpretation as they may show different prediction results in relation to specific clinical characteristics.
INTRODUCTION
MATERIALS AND METHODS
RESULTS
DISCUSSION
KEY MESSAGES
-
CONFLICT OF INTEREST
No potential conflict of interest relevant to this article was reported.
-
AUTHOR CONTRIBUTIONS
Conceptualization: BL. Data curation: BL, YSK, YHC. Formal analysis: EJL, BL. Methodology: EJL, BL. Project administration: BL. Visualization: EJL, BL. Writing–original draft: EJL. Writing–review & editing: BL, YSK, YHC, YHK, JDP.
NOTES


| Variable | Values (n=945) |
|---|---|
| Age (yr) | 3.0 (0.0 to 8.0) |
| Female | 422 (44.7) |
| Length of stay in ICU (hr) | 24.2 (19.0 to 77.7) |
| Underlying disease | |
| Cardiovascular disease | 138 (13.3) |
| Endocrinologic disease | 48 (4.6) |
| Gastrointestinal disease | 84 (8.1) |
| Genetic disease | 108 (10.4) |
| Genitourinary disease | 62 (6) |
| Hemato-oncologic disease | 174 (16.8) |
| Infectious disease | 42 (4.1) |
| Neuromuscular disease | 171 (16.5) |
| Ophthalmologic disease | 27 (2.6) |
| Psychologic disease | 38 (3.7) |
| Respiratory disease | 119 (11.5) |
| Trauma | 25 (2.4) |
| Physical finding | |
| Z-score of SBP by age | 0.0 (–0.7 to 0.7) |
| Z-score of DBP by age | –0.0 (–0.7 to 0.6) |
| Z-score of MBP by age | 0.0 (–0.6 to 0.6) |
| Z-score of HR by age | 0.0 (–0.7 to 0.7) |
| Z-score of RR by age | 0.0 (–0.7 to 0.7) |
| Body temperature (℃) | 36.8 (36.3 to 37.2) |
| Oxygen saturation (%) | 99.0 (95.0 to 100.0) |
| Glasgow coma scale | |
| Eye | 4.0 (4.0 to 4.0) |
| Verbal | 5.0 (5.0 to 5.0) |
| Motor | 6.0 (6.0 to 6.0) |
| Fixed pupil reflex, both | 14 (1.5) |
| Clinical finding | |
| Vasoactive-inotropic score | 0.0 (0.0–3.2) |
| Mechanical ventilation application | 696 (73.7) |
| Laboratory finding | |
| pH | 7.4 (7.3 to 7.4) |
| Partial pressure of CO2 (mm Hg) | 41.0 (36.0 to 47.0) |
| Total CO2 (mmol/L) | 24.0 (21.5 to 27.2) |
| Base excess (mmol/L) | –0.8 (–3.5 to 1.4) |
| Leukocyte (×103 cells/μl) | 9.4 (5.6 to 13.9) |
| Platelet (×103 cells/μl) | 192.0 (106.0 to 282.0) |
| Glucose (mg/dl) | 115.0 (87.0 to 156.0) |
| Potassium (mg/dl) | 4.0 (3.6 to 4.4) |
| Lactate (mmol/L) | 1.5 (0.9 to 2.5) |
| BUN (mg/dl) | 8.0 (5.0 to 10.0) |
| Creatinine (mg/dl) | 0.3 (0.1 to 0.4) |
| Bilirubin (mg/dl) | 0.6 (0.3 to 1.0) |
| PT-INR | 1.2 (1.1 to 1.3) |
| aPTT (sec) | 34.7 (29.9 to 42.0) |
| Elective admission to ICUa | 773 (81.8) |
| Association between ICU admission and surgerya | |
| Not related to surgery | 200 (21.2) |
| Bypass cardiac surgery | 209 (22.1) |
| Non-bypass cardiac surgery | 44 (4.7) |
| Non-cardiac surgery | 492 (52.1) |
| Low-risk diagnosisa | |
| None | 909 (96.2) |
| Bronchiolitis | 4 (0.4) |
| Diabetic ketoacidosis | 6 (0.6) |
| Seizure | 26 (2.8) |
| High-risk diagnosisa | |
| None | 908 (96.1) |
| Spontaneous cerebral hemorrhage | 12 (1.3) |
| Cardiomyopathy or myocarditis | 15 (1.6) |
| Hypoplastic left heart syndrome | 1 (0.1) |
| Neurodegenerative disorder | 3 (0.3) |
| Necrotizing enterocolitis | 6 (0.6) |
| Very high-risk diagnosisa | |
| None | 913 (96.6) |
| Cardiac arrest | 15 (1.6) |
| Severe combined immune deficiency | 2 (0.2) |
| Leukemia or lymphoma after first induction | 3 (0.3) |
| Bone marrow transplant recipient | 6 (0.6) |
| Liver failure | 6 (0.6) |
| Predicted mortality rate by PIM 3 | 2.0 (0.9 to 2.7) |
| Predicted mortality rate by PELOD-2 | 0.9 (0.5 to 1.4) |
| Observed all-cause ICU mortality | 17 (1.8) |
Values are presented as median (interquartile range) or number (%).
ICU: intensive care unit; SBP: systolic blood pressure; DBP: diastolic BP; MBP: mean BP; HR: heart rate; RR: respiratory rate; CO2: carbon dioxide; BUN: blood urea nitrogen; PT INR: prothrombin time international normalized ratio; aPTT: activated partial thromboplastin time; PIM 3: pediatric index of mortality 3; PELOD-2: pediatric logistic organ dysfunction-2.
a For this classification, the criteria of the PIM 3 calculation formula were used [4].
| Variable |
Univariable analysis |
Multivariable analysis |
||||
|---|---|---|---|---|---|---|
| Estimate | SE | P-value | Estimate | SE | P-value | |
| Age (yr) | 0.059 | 0.031 | 0.055 | |||
| Sex | ||||||
| Male | Reference | |||||
| Female | –0.466 | 0.310 | 0.133 | |||
| Physical finding | ||||||
| Z-score of SBP by age | 0.247 | 0.155 | 0.113 | |||
| Z-score of HR by age | 0.140 | 0.154 | 0.364 | |||
| Z-score of RR by age | 0.142 | 0.155 | 0.359 | |||
| Body temperature (℃) | 0.075 | 0.192 | 0.696 | |||
| Oxygen saturation (%) | –0.091 | 0.015 | <0.001 | –0.065 | 0.012 | <0.001 |
| Glasgow coma scale | ||||||
| Eye | 0.700 | 0.183 | <0.001 | |||
| Verbal | 0.407 | 0.121 | 0.001 | |||
| Motor | 0.718 | 0.143 | <0.001 | |||
| Fixed pupil reflex | 0.948 | 1.277 | 0.458 | |||
| Clinical finding | ||||||
| Vasoactive-inotropic score | –0.006 | 0.008 | 0.410 | |||
| Mechanical ventilation | ||||||
| No | Reference | |||||
| Yes | 0.672 | 0.350 | 0.055 | |||
| Laboratory finding | ||||||
| pH | –15.690 | 1.656 | <0.001 | |||
| Partial pressure of CO2 (mm Hg) | 0.082 | 0.014 | <0.001 | 0.041 | 0.010 | <0.001 |
| Total CO2 (mmol/L) | –0.028 | 0.032 | 0.372 | |||
| Base excess (mmol/L) | –0.223 | 0.035 | <0.001 | –0.124 | 0.024 | <0.001 |
| Leukocyte (×103 cells/μl) | 0.053 | 0.021 | 0.013 | |||
| Platelet (×103 cells/μl) | 0.005 | 0.001 | <0.001 | 0.004 | 0.001 | <0.001 |
| Glucose (mg/dl) | 0.000 | 0.002 | 0.786 | |||
| Potassium (mg/dl) | 0.266 | 0.124 | 0.033 | |||
| Lactate (mmol/L) | 0.435 | 0.089 | <0.001 | |||
| BUN (mg/dl) | 0.081 | 0.020 | <0.001 | 0.045 | 0.017 | 0.008 |
| Creatinine (mg/dl) | 0.377 | 0.295 | 0.202 | |||
| Bilirubin (mg/dl) | 0.114 | 0.096 | 0.234 | |||
| PT | 0.070 | 0.024 | 0.004 | |||
| PT INR | 1.588 | 0.436 | <0.001 | |||
| aPTT (sec) | –0.002 | 0.009 | 0.808 | |||
| Elective admission to ICUa | ||||||
| No | Reference | |||||
| Yes | –2.825 | 0.389 | <0.001 | |||
| Association between ICU admission and surgerya | ||||||
| Not related to surgery | Reference | Reference | ||||
| Bypass cardiac surgery | –2.786 | 0.361 | <0.001 | –2.083 | 0.264 | <0.001 |
| Non-bypass cardiac surgery | 1.908 | 0.730 | 0.009 | |||
| Non-cardiac surgery | 0.018 | 0.309 | 0.955 | |||
| Low-risk diagnosisa | ||||||
| None | Reference | Reference | ||||
| Bronchiolitis | –3.210 | 2.375 | 0.177 | |||
| Diabetic ketoacidosis | –2.215 | 1.942 | 0.254 | |||
| Seizure | –2.998 | 0.938 | 0.001 | -3.598 | 0.723 | <0.001 |
| High-risk diagnosisa | ||||||
| None | Reference | Reference | ||||
| Spontaneous cerebral hemorrhage | 2.024 | 1.377 | 0.142 | |||
| Cardiomyopathy or myocarditis | 3.281 | 1.230 | 0.008 | 3.810 | 0.948 | <0.001 |
| Hypoplastic left heart syndrome | 0.654 | 4.747 | 0.891 | |||
| Neurodegenerative disorder | 0.934 | 2.743 | 0.733 | |||
| Necrotizing enterocolitis | 5.547 | 1.935 | 0.004 | 4.356 | 1.356 | 0.001 |
| Very high-risk diagnosisa | ||||||
| None | Reference | Reference | ||||
| Cardiac arrest | 23.157 | 0.978 | <0.001 | 20.691 | 0.813 | <0.001 |
| Severe combined immune deficiency | 4.838 | 3.355 | 0.150 | |||
| Leukemia or lymphoma after first induction | 6.826 | 2.734 | 0.013 | 9.066 | 2.163 | <0.001 |
| Bone marrow transplant recipient | 6.635 | 1.931 | 0.001 | 6.255 | 1.542 | <0.001 |
| Liver failure | 5.937 | 1.933 | 0.002 | 5.907 | 1.257 | <0.001 |
SE: standard error; SBP: systolic blood pressure; HR: heart rate; RR: respiratory rate; CO2: carbon dioxide; BUN: blood urea nitrogen; PT INR: prothrombin time international normalized ratio; aPTT: activated partial thromboplastin time; ICU: intensive care unit.
a For this classification, the criteria of the PIM 3 calculation formula were used [4].
- 1. Wolfler A, Osello R, Gualino J, Calderini E, Vigna G, Santuz P, et al. The importance of mortality risk assessment: validation of the Pediatric Index of Mortality 3 score. Pediatr Crit Care Med 2016;17:251-6.PubMed
- 2. Seymour CW, Gesten F, Prescott HC, Friedrich ME, Iwashyna TJ, Phillips GS, et al. Time to treatment and mortality during mandated emergency care for sepsis. N Engl J Med 2017;376:2235-44.ArticlePubMedPMC
- 3. Khwannimit B, Bhurayanontachai R, Vattanavanit V. Comparison of the accuracy of three early warning scores with SOFA score for predicting mortality in adult sepsis and septic shock patients admitted to intensive care unit. Heart Lung 2019;48:240-4.ArticlePubMed
- 4. Straney L, Clements A, Parslow RC, Pearson G, Shann F, Alexander J, et al. Paediatric index of mortality 3: an updated model for predicting mortality in pediatric intensive care. Pediatr Crit Care Med 2013;14:673-81.PubMed
- 5. Leteurtre S, Duhamel A, Salleron J, Grandbastien B, Lacroix J, Leclerc F, et al. PELOD-2: an update of the PEdiatric logistic organ dysfunction score. Crit Care Med 2013;41:1761-73.PubMed
- 6. Schlapbach LJ, Straney L, Bellomo R, MacLaren G, Pilcher D. Prognostic accuracy of age-adapted SOFA, SIRS, PELOD-2, and qSOFA for in-hospital mortality among children with suspected infection admitted to the intensive care unit. Intensive Care Med 2018;44:179-88.ArticlePubMedPDF
- 7. El-Nawawy A, Mohsen AA, Abdel-Malik M, Taman SO. Performance of the pediatric logistic organ dysfunction (PELOD) and (PELOD-2) scores in a pediatric intensive care unit of a developing country. Eur J Pediatr 2017;176:849-55.ArticlePubMedPDF
- 8. Sankar J, Gulla KM, Kumar UV, Lodha R, Kabra SK. Comparison of outcomes using Pediatric Index of Mortality (PIM) -3 and PIM-2 models in a pediatric intensive care unit. Indian Pediatr 2018;55:972-4.ArticlePubMedPDF
- 9. Lee OJ, Jung M, Kim M, Yang HK, Cho J. Validation of the Pediatric Index of Mortality 3 in a single pediatric intensive care unit in Korea. J Korean Med Sci 2017;32:365-70.ArticlePubMedPDF
- 10. Jacobe SJ, Hassan A, Veys P, Mok Q. Outcome of children requiring admission to an intensive care unit after bone marrow transplantation. Crit Care Med 2003;31:1299-305.ArticlePubMed
- 11. Russell RA, Ghanayem NS, Kuhn EM, Jeffries HE, Scanlon MC, Rice TB. Relationship between risk-adjustment tools and the pediatric logistic organ dysfunction score. World J Pediatr Congenit Heart Surg 2014;5:16-21.ArticlePubMedPDF
- 12. Fleming S, Thompson M, Stevens R, Heneghan C, Plüddemann A, Maconochie I, et al. Normal ranges of heart rate and respiratory rate in children from birth to 18 years of age: a systematic review of observational studies. Lancet 2011;377:1011-8.ArticlePubMedPMC
- 13. Stasinopoulos DM, Rigby RA. Generalized additive models for location scale and shape (GAMLSS) in R. J Stat Softw 2008;23:1-46.Article
- 14. Cole TJ, Donaldson MD, Ben-Shlomo Y. SITAR: a useful instrument for growth curve analysis. Int J Epidemiol 2010;39:1558-66.ArticlePubMedPMC
- 15. Arias López MD, Boada N, Fernández A, Fernández AL, Ratto ME, Siaba Serrate A, et al. Performance of the Pediatric Index of Mortality 3 score in PICUs in Argentina: a prospective, national multicenter study. Pediatr Crit Care Med 2018;19:e653-61.ArticlePubMedPMC
- 16. Jung JH, Sol IS, Kim MJ, Kim YH, Kim KW, Sohn MH. Validation of Pediatric Index of Mortality 3 for predicting mortality among patients admitted to a pediatric intensive care unit. Acute Crit Care 2018;33:170-7.ArticlePubMedPMCPDF
- 17. Niederwanger C, Varga T, Hell T, Stuerzel D, Prem J, Gassner M, et al. Comparison of pediatric scoring systems for mortality in septic patients and the impact of missing information on their predictive power: a retrospective analysis. PeerJ 2020;8:e9993.ArticlePubMedPMCPDF
- 18. Ramazani J, Hosseini M. Comparison of the predictive ability of the pediatric risk of mortality iii, pediatric index of mortality3, and pediatric logistic organ dysfunction-2 in medical and surgical intensive care units. J Compr Ped 2019;10:e82830.
- 19. Wong JJ, Hornik CP, Mok YH, Loh TF, Lee JH. Performance of the Paediatric Index of Mortality 3 and Paediatric Logistic Organ Dysfunction 2 scores in critically ill children. Ann Acad Med Singap 2018;47:285-90.ArticlePubMed
- 20. Gonçalves JP, Severo M, Rocha C, Jardim J, Mota T, Ribeiro A. Performance of PRISM III and PELOD-2 scores in a pediatric intensive care unit. Eur J Pediatr 2015;174:1305-10.ArticlePubMedPDF
- 21. Karam O, Demaret P, Duhamel A, Shefler A, Spinella PC, Stanworth SJ, et al. Performance of the PEdiatric Logistic Organ Dysfunction-2 score in critically ill children requiring plasma transfusions. Ann Intensive Care 2016;6:98. ArticlePubMedPMCPDF
 PubReader
 ePub Link
 Cite
Cite